
Figure 3.
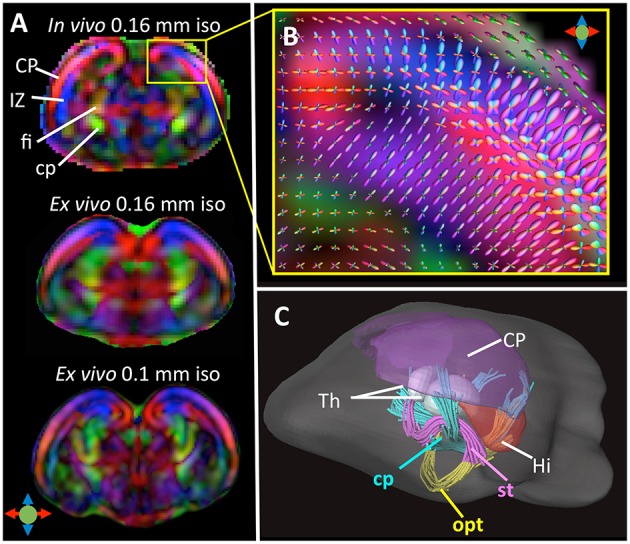
(A) Top: A coronal DTI colomap of an embryonic mouse brain at embryonic day 17 (E17) acquired in vivo using the localized imaging approach at an isotropic spatial resolution of 0.16 mm. Mid and bottom: comparable ex vivo DTI colormaps of an E17 embryonic mouse brain acquired at 0.16 and 0.1 mm isotropic resolution. (B) A local fiber orientation distribution (FOD) map showing radially and tangentially distributed microstructures in the cortical plate and intermediate zone, overlapped on a zoomed-in region from (A). (C) Early white matter tracts reconstructed from the in vivo dMRI data including the cerebral peduncle (cp), optic tract (opt), and stria terminalis (st). Also shown here are several gray matter structures: cortical plate (CP), hippocampus (Hi), and thalamus (Th). The color scheme used in the DTI colormaps and TDI are: red: left-right; blue: ventral-dorsal; green: rostral-caudal, as indicated by the color arrows in (A). The images in this figure are modified from Wu et al. (2015) with permission.