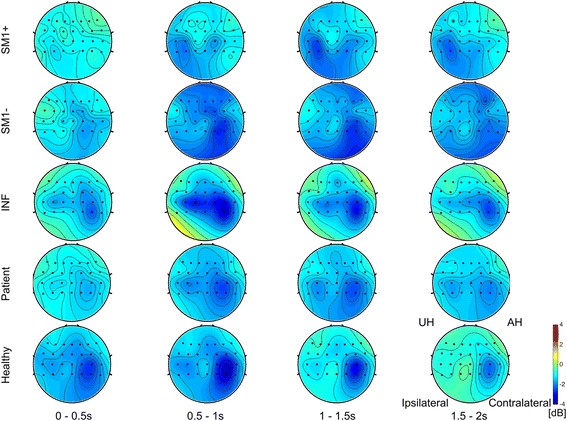
Fig. 3.

Twenty-eight channel topography of the beta band during active supination movement. The horizontal axis represents 2 s of the motor task with a 0.5-s window interval. The vertical axis represents the subject groups. The upper three rows represent each subgroup of patients according to their lesion location. The fourth row represents all patients and the last row represents the healthy controls
