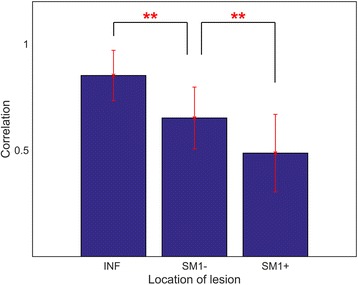
Fig. 4.

Pearson’s correlation coefficients for the beta band power changes between the HCs and each of the three patient subgroups for each of the 28 channels during the active task supination movement. Significant results of a pairwise statistical analysis on the differences in the correlation coefficients are indicated (one-way ANOVA test, **p < 0.01)
