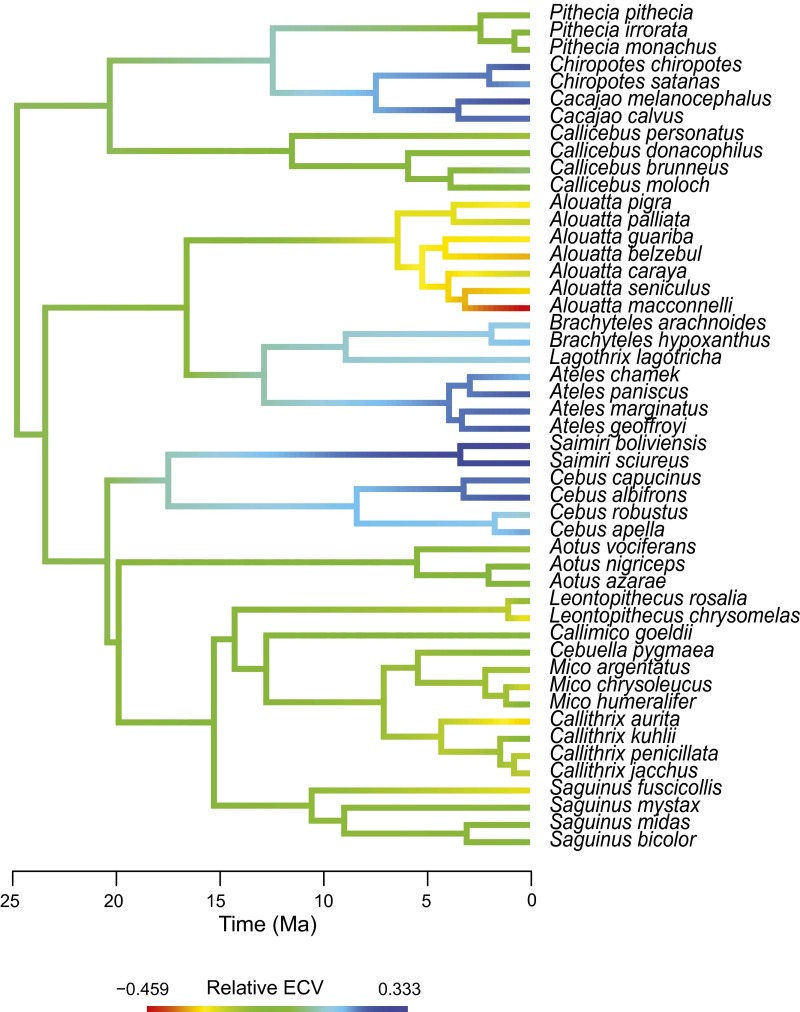
Fig. S2.
Measured rECV (encephalization) values for each species mapped on the phylogeny. Values at nodes and branches were reconstructed using a maximum-likelihood ancestral character estimation method based on a Brownian motion model of evolution (57). Although ancestral reconstructions can have a large uncertainty, this tool is useful to visualize general trends in the evolution of a character.

