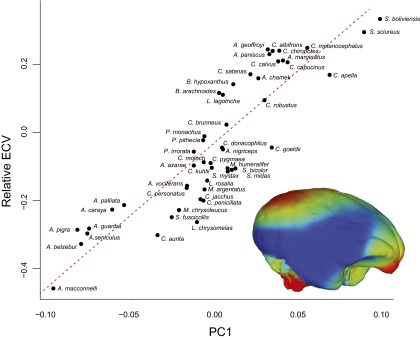
Fig. S3.
PGLS regression of encephalization (rECV) on the main axis of platyrrhine brain shape variation (PC1). Colors in the brain model shows the areas in which shape change is concentrated along PC1. Red colors indicate the most shape change, whereas blue colors indicate less change. Colors were assigned based on a Procrustean superimposition of the extremes of variation along PC1.

