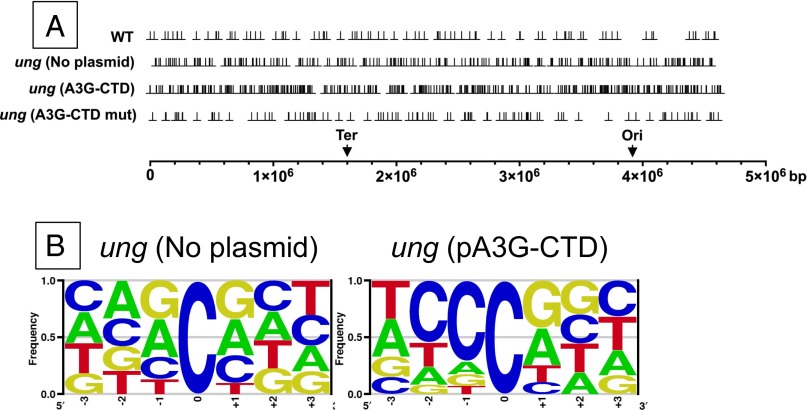
Fig. 1.
Distribution and sequence context of C:G to T:A mutations. (A) Distribution of mutations. The positions of C:G to T:A mutations were plotted using the Graph Prism 6 for Mac software and are shown using the perpendicularity symbol (⊥); the strains in which the mutations occurred are indicated on the left. A straight line at the bottom is used to represent the E. coli genome, and downward arrows mark the positions of the replication origin (Ori) and terminus (Ter). (B) Sequence context of mutations. The three nucleotides on either side of the C:G pair that was mutated to T:A were used to create LOGOS plots using enoLOGOS software (63).

