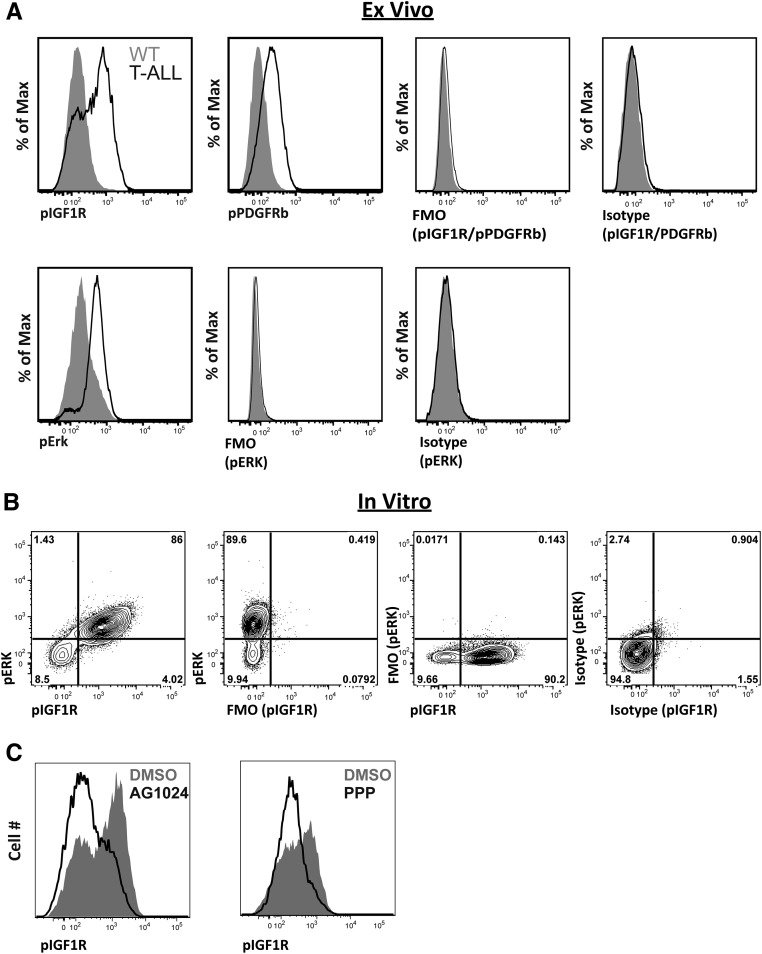
Fig. S7.
Flow cytometric controls for analysis of intracellular phosphorylated protein levels by flow cytometry. (A) Representative flow cytometric histograms of immunostaining for pIGF1R, pPDGFRβ, and pErk reveal specificity of the stain relative to background fluorescence revealed by FMO and isotype controls in ex vivo WT thymocytes and LN3 thymic T-ALL cells. (B) Representative flow cytometric plots of pIGF1R versus pErk in T-ALL cells cultured for 7 d with tumor-associated DCs. FMO and isotype controls reveal specificity of the immunostaining. (C) Representative flow cytometric plots evaluating pIGF1R levels in 1 × 10⁴ viable thymic T-ALL cells from tumor:DC cocultures 2 h after addition of the IGF1R inhibitors AG-1024 (10 μM) or PPP (5 μM) in comparison to DMSO vehicle controls. (A–C) Results are representative of at least three independent experiments.

