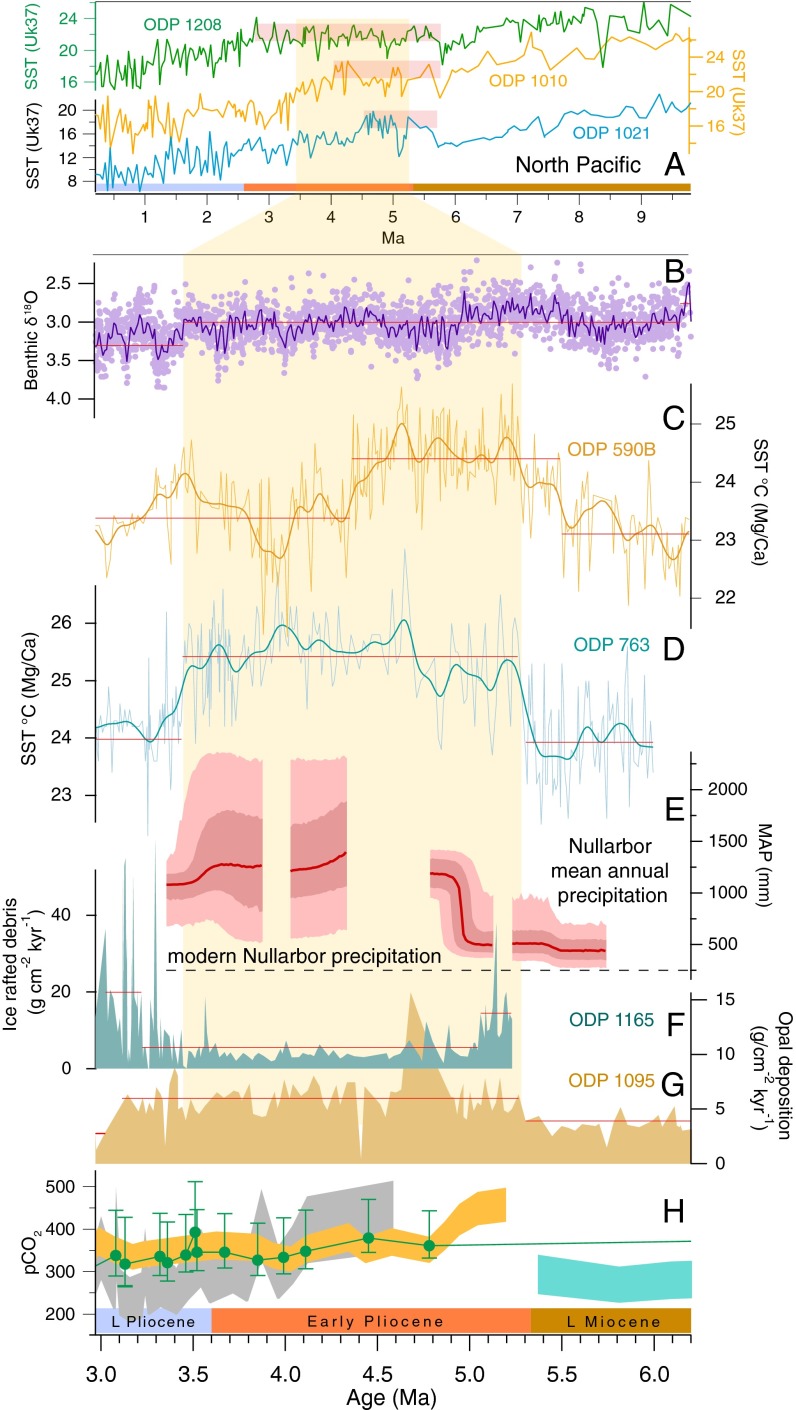
Fig. 4.
Nullarbor mean annual precipitation reconstruction and proxies for Southern Hemisphere and northern Pacific Ocean sea surface temperatures. (A) Alkenone-derived SST records from north Pacific Ocean ODP sites 1208, 1010, and 1021 (12); warm intervals are indicated by pink shading (for locations, see Fig. 2); note the separate time axis compared with B–H. (B) Benthic foraminifera δ18O record (44) with 10-ka smoothing (dark purple line), change points at 6.14 and 3.45 Ma. (C) Mg/Ca-derived SSTs, ODP Site 590B, south-western Pacific (34); change points are at 5.49 and 4.35 Ma. (D) Mg/Ca-derived SSTs, ODP Site 763, north-eastern Indian Ocean (33); the warm interval is defined by change points at 5.26 and 3.44 Ma, indicated by yellow shading. (E) Monte Carlo simulation of Nullarbor late Miocene–Pliocene mean annual precipitation. (F) Ice-rafted debris (>125 µm), ODP Site 1165, Prydz Bay (45); change points are at 5.22, 5.04, 3.22, and 2.95 Ma. (G) Opal deposition rate, ODP Site 1095, Bellinghausen Sea, interpreted at this site as a proxy for open water, hence SST (46); change points are at 5.27 and 3.02 Ma. (H) Proxy reconstructions of atmospheric pCO2, derived from alkenones [turquoise (31) and yellow (32) shading, green circles with error bars (30)], and from δ11B [gray shading (47)]. Red horizontal lines are significant change points in the mean for B–D and F and G. Shaded boxes indicate the duration of intervals of warming.

