Fig. 2.
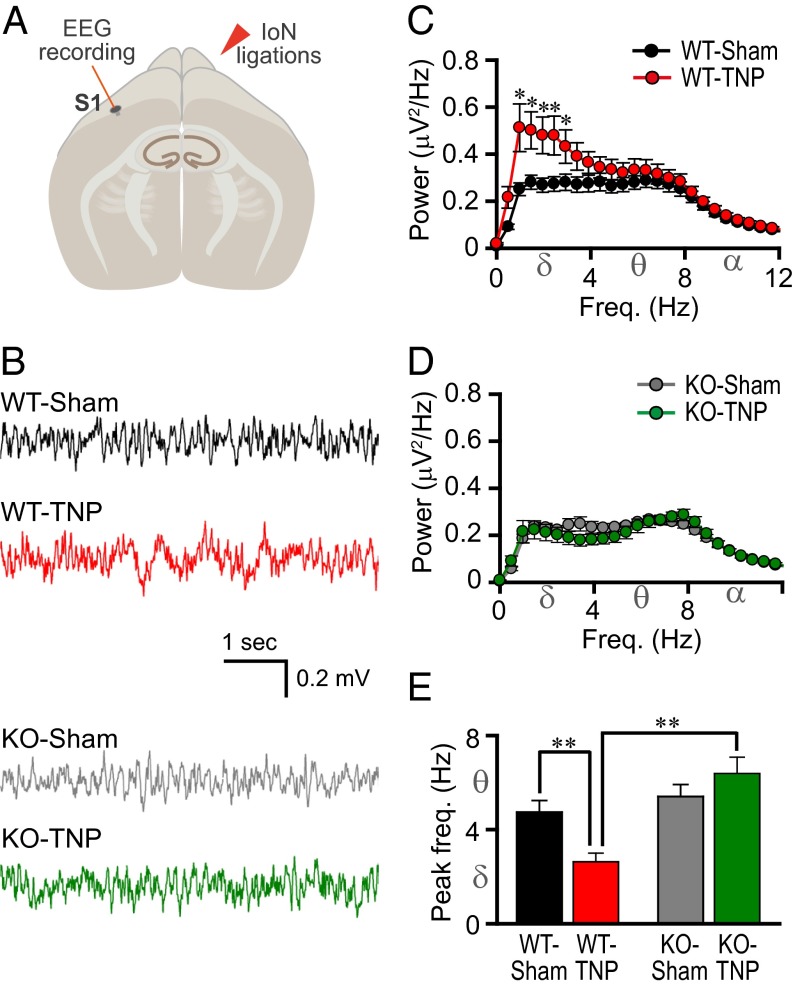
Reduced S1 cortex low-frequency rhythm in mice lacking CaV3.1 T-type Ca2+ channels after IoN ligation. (A) Schematic drawing of an EEG S1 recording site. (B) Representative EEG traces. (C) Mean absolute spectral power as a function of frequency for WT-sham (n = 14) and WT-TNP (n = 13). (D) Mean absolute spectral power as a function of frequency for KO-sham (n = 13) and KO-TNP (n = 12). (E) Peak EEG frequency in the S1 cortex. The power of low-frequency oscillations in WT-TNP (red) was greater than that in sham-operated WT mice (black) (C, *P < 0.05 by Student’s t test). There was no significant difference between KO-sham (gray) and KO-TNP (green) (D, P > 0.05 by Student’s t test). Note that the power of low-frequency oscillations (1–5 Hz) was significantly lower in IoN-ligated CaV3.1 KO (D, green) than in WT-TNP mice (C, red) (P < 0.05 by Student’s t test). The peak frequency was shifted from theta toward delta in WT after IoN ligations (E, **P < 0.01 by Student’s t test). The peak frequency of CaV3.1 KO-TNP was greater than that of WT-TNP (E, **P < 0.01 by Mann–Whitney rank-sum test; peak in theta rhythm range in KO-TNP and peak in delta rhythm range in WT-TNP). All values represent mean ± SEM.

