Fig. 3.
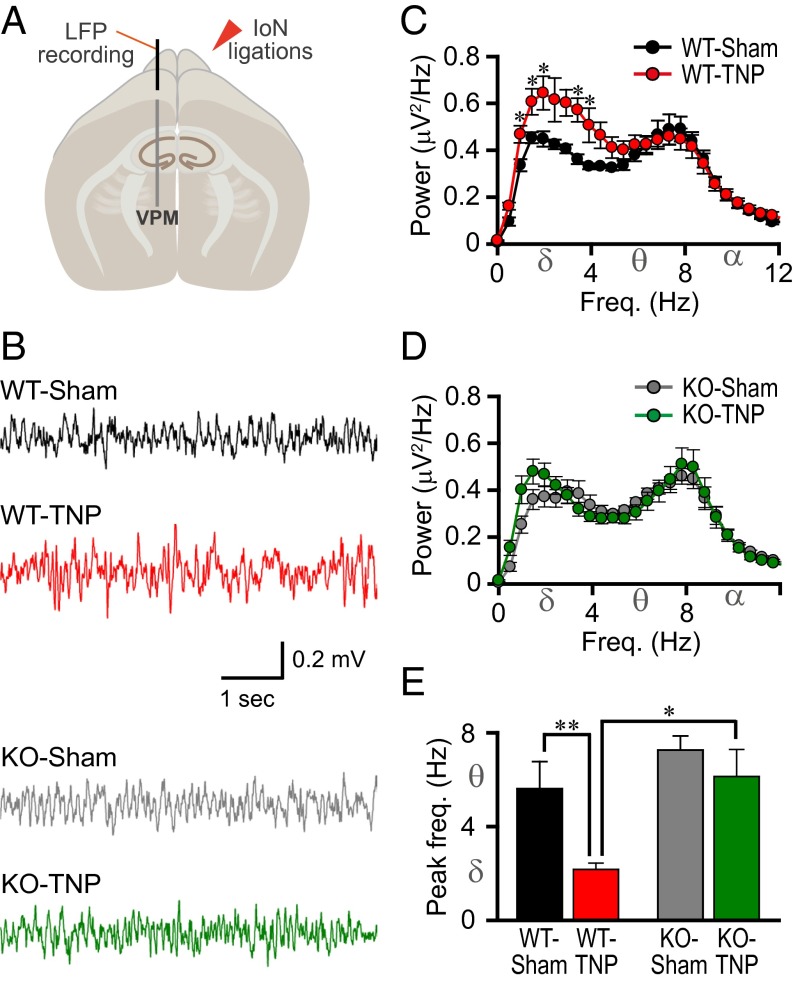
Reduced low-frequency rhythms and lack of peak frequency shift in the VPM of the thalamus in CaV3.1 KO mice after IoN ligations. (A) Schematic drawing of an LFP recording from the VPM. (B) Representative traces. (C) Mean absolute spectral power as a function of frequency for WT-sham (black, n = 7) and WT-TNP (red, n = 9). (D) Mean absolute spectral power as a function of frequency for KO-sham (gray, n = 8) and KO-TNP (green, n = 8). (E) Peak LFP frequency in the VPM. The spectral profile in the VPM showed a significantly increased low-frequency rhythm after IoN ligation in the WT (C, *P < 0.05 by Student’s t test, WT-sham vs. WT-TNP). There was no significant difference between KO-sham and KO-TNP (D, P > 0.05 by Student’s t test). The absolute power of low-frequency oscillations (1–4 Hz) was significantly lower in CaV3.1 KO with IoN ligations (KO-TNP, D, green), compared with low-frequency rhythms in WT-TNP (C, red, *P < 0.05 by Student’s t test, WT-TNP vs. KO-TNP). The peak frequency of thalamic LFP in WT-TNP mice was shifted to delta band range, compared with the theta band range of WT-sham (E, **P < 0.01 by Student’s t test). However, the peak frequency of CaV3.1 KO-TNP was in the theta rhythm range, as in the S1 cortex EEG (Fig. 2). All values represent mean ± SEM.

