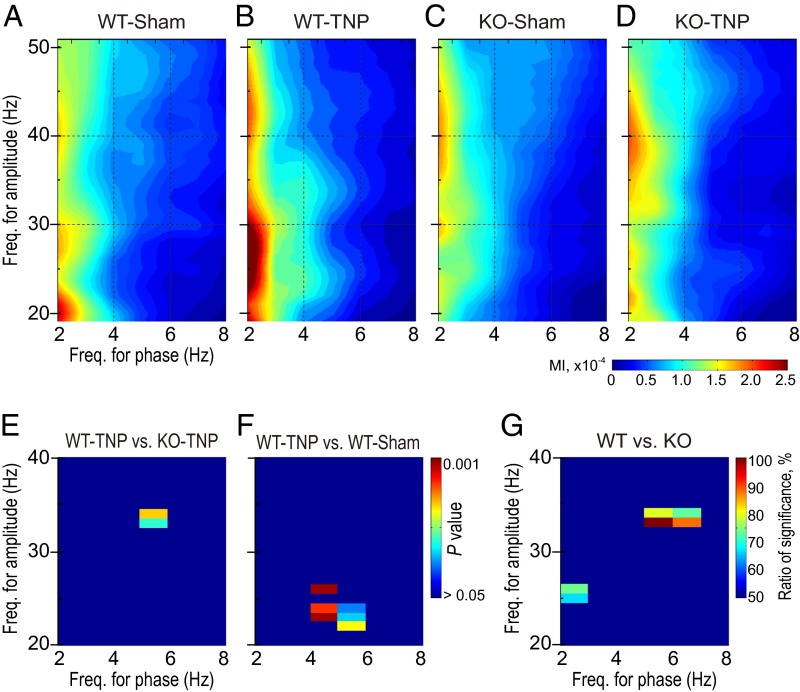
Fig. 5.
CFC in the EEG from the S1 cortex. (A–D) Grand average of the cross-frequency coupling showing interactions under the four conditions studied: WT-sham (A), WT-TNP (B), KO-sham (C), and KO-TNP (D) (n = 12 for each condition). The magnitude of this coupling (modulation index; MI) was calculated for pairs of phases of delta/theta (2–8 Hz, abscissa) and amplitudes of beta/gamma oscillations (20–50 Hz, ordinate). Warm colors indicate higher values of phase–amplitude coupling. In WT-TNP (B), the phase of delta/theta rhythms strongly entrained the amplitude of the beta/gamma rhythm, revealing a predominant low-frequency rhythm–to–high-frequency coupling. (E and F) Statistical significance of the difference between CaV3.1 WT-TNP and KO-TNP (E) or between WT-TNP and WT-sham mice (F) using the Mann–Whitney rank-sum test with Bonferroni correction. Cross-frequency bins in which the CFC increased significantly (P < 0.05) were found in low-frequency rhythm–to–gamma CFC in WT-TNP, compared with KO-TNP (E) and WT-sham (F). (G) Statistical significance of the difference between CaV3.1 WT and KO using random sampling comparison with Friedman’s two-way ANOVA. Warm colors indicate the cross-frequency coupling bins showing statistical significance (P < 0.05 with more than 50% of the 100 repetitive random sampling trials).

