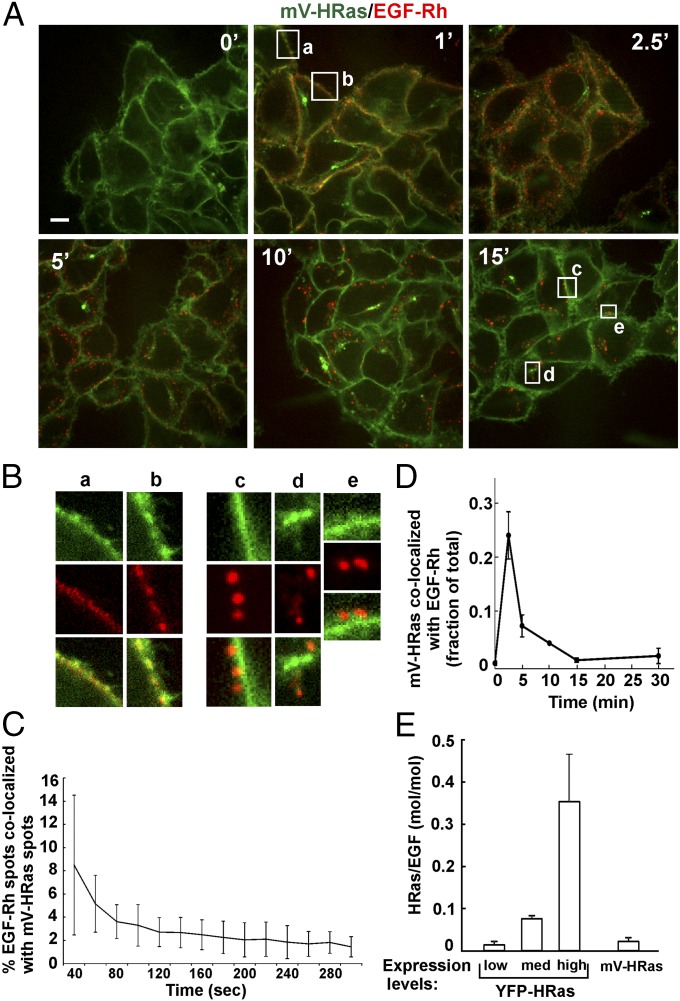
Fig. 2.
Localization of mVenus-HRas in cells stimulated with EGF-Rh. (A) HeLa/mV-HRas cells were incubated with 4 ng/mL EGF-Rh at 37 °C for indicated times, and live-cell imaging was performed through 515-nm (mVenus; green) and 561-nm (rhodamine; red) channels. The image acquisition time was 1.2 s for mVenus throughout the time course, whereas for rhodamine it was 600 ms (0–5 min), 400 ms (10 min), and 200 ms (15 min) to avoid rhodamine signal saturation in endosomes at later time points. (Scale bar: 10 µm.) (B) Insets show high-magnification images of regions indicated by white rectangles in A to demonstrate an overlap of EGF-Rh and mV-HRas fluorescence in the plasma membrane (a and b) and no overlap of EGF-Rh and mV-HRas in endosomes (c–e). (C) The cell bottom surface of HeLa/mV-HRas cells was continuously imaged during stimulation with 4 ng/mL EGF-Rh at 37 °C using TIR-FM. EGF-Rh was added at a 10-s time point. Typically, specific cell-bound fluorescence of EGF-Rh was detected at ∼40-s time point. The percentage of EGF-Rh–positive spots colocalized with mV-HRas spots relative to the total number of EGF-Rh spots is plotted against time. Mean values (±SD; n = 4) are presented. Corresponding representative images are shown in Fig. S4. (D) HeLa/mV-HRas cells were incubated with 4 ng/mL EGF-Rh as in A, and z stacks of 18–21 confocal images were acquired through 515- and 561-nm channels using the same image acquisition parameters as in A. The percentage of mV-HRas colocalized with EGF-Rh relative to the total cellular mV-HRas fluorescence was calculated in multiple 3D images. Mean values (±SD) are presented. (E) Parental HeLa cells transiently expressing YFP-HRas or HeLa/mV-HRas cells were incubated with 4 ng/mL EGF-Rh for 15 min at 37 °C, and z stacks of confocal images were acquired through 515- and 561-nm channels. Representative images of YFP-HRas are shown in Fig. S5. Total amounts of YFP-HRas or mV-HRas per cell were calculated from 3D images using segmentation. Mean YFP-HRas expression levels were calculated as fold difference to the mean expression level of mV-HRas (× mV-HRas). Molar stoichiometry (515/561 ratio) of mV-HRas or YFP-HRas to EGF-Rh in endosomes was calculated in, respectively, HeLa/mV-HRas cells or parental cells expressing low (mean expression, 0.6× mV-HRas), intermediate (“med,” mean expression, 10.7× mV-HRas), and high (mean expression, 55.4× mV-HRas) levels of YFP-HRas. Mean 515/561 ratio values (±SD) obtained from 100 to 240 endosomes at each condition are presented.

