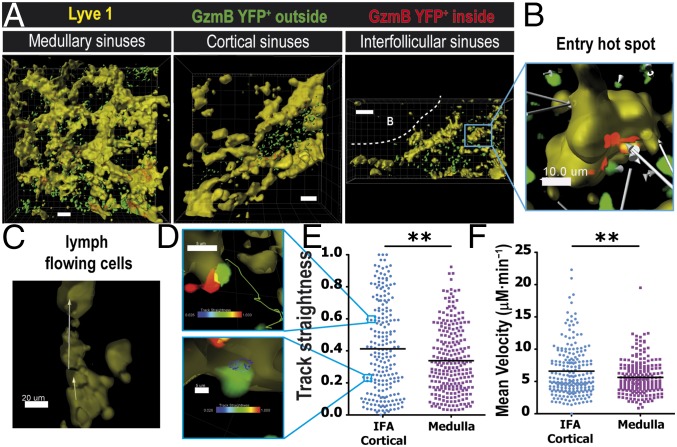
Fig. 2.
Dynamics of endogenous effector CD8 T-cell egress. (A) GzmBERT2/ROSAEYFP (GzmB YFP) mice were infected in the foot pad with VSV, followed by tamoxifen treatment as before (days 3 and 4 p.i.). (A) Snapshots of 2P imaging showing surface rendering of lymphatic sinuses (Lyve1; yellow) and GzmB YFP+ cells inside (red) versus outside (green) the lymphatic sinuses. Shown are 3D reconstruction projections of several z stacks showing the medullary sinuses (Left; 114 µm depth), cortical sinuses (Center; 165 µm depth), and interfollicular sinuses (Right; 65 µm depth). (Scale bars: 50 μm.) (B) Close-up depicting an entry hot spot of endogenous effector T cells going in the same direction toward the lymphatic. White arrows illustrate the displacement (Movie S2). (Scale bar: 10 μm.) (C) Unidirectional displacement (white arrows) of GzmB YFP+ T cells flowing inside a cortical sinus (yellow). (D) Two distinct behaviors from (E) the track straightness graph analysis; a straight track (upper image, green track) and a confined track (bottom image, blue track). Tracks are color-coded based on the track straightness indicated by the colored bars. (F) Velocity in μM⋅min−1 from an interfollicular area (IFA)/cortical (blue dots) and a medullary region (purple squares). Results representative of 6 different movies. **P < 0.001.

