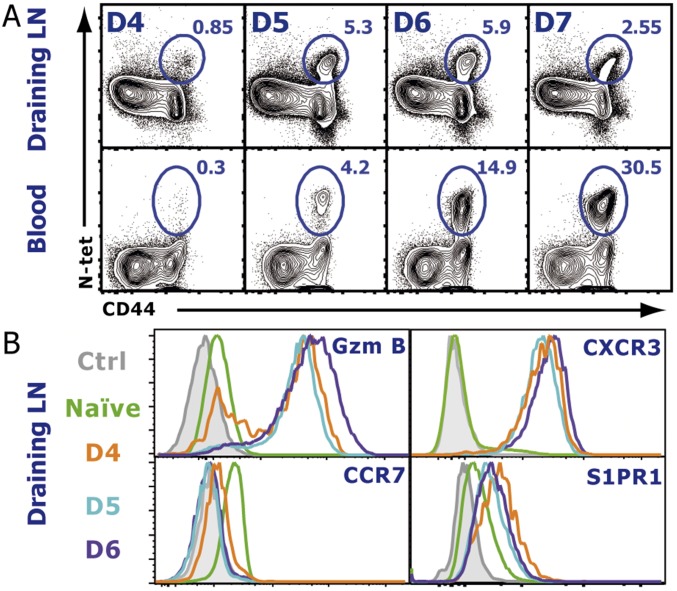
Fig. S1.
Endogenous antigen-specific T-cell egress kinetics and phenotype after infection. (A) At the indicated days p.i., the dLN (popliteal) and blood were harvested, and VSV-specific CD8 T cells were detected by staining with an N-Kb tetramer. Dot plots represent gated CD8+ cells. (B) Time course of the chemokine receptor expression on CD8+, CD44+, N-tet+ effector T cells. Naive cells were gated on CD44−, CD62lhi T cells. See also Fig. S1 for N-tet distribution and Fig. S2 for CD4+ LLO-tet+ phenotype. The data shown are representative of six different experiments with three mice per time point.

