Fig. 2.
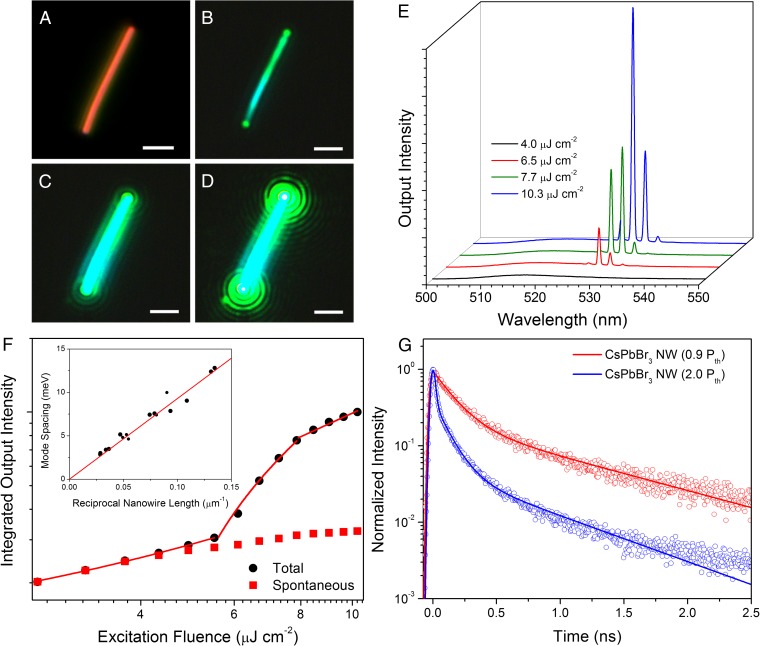
Lasing in single-crystal CsPbBr3 nanowires. (A) Dark-field image of a CsPbBr3 nanowire. (B–D) The nanowire from A under excitation from a femtosecond pulsed laser with increasing excitation fluence. (Scale bar, 2 µm.) (E) Power-dependent emission spectra from the CsPbBr3 nanowire shown in images A–D. Narrow emission peaks at ∼530 nm are indicative of lasing. (F) The integrated output intensity of the CsPbBr3 nanowire with increasing pump fluence (black circles) follows a typical S-curve pattern and can be linearly fit to show three separate emission regimes: spontaneous emission (<5 µJ cm−2), amplified spontaneous emission (5–10 µJ cm−2), and lasing (>10 µJ cm−2). Spontaneous emission (red squares) from the nanowire plateaus as stimulated emission begins to dominate. (Inset) Plot of inverse nanowire length against mode spacing, confirming that Fabry–Pérot-type lasing is dominant. (G) TRPL from a CsPbBr3 nanowire below (red) and above (blue) the lasing threshold (Pth). The emergence of a rapid decay component (<10 ps) suggests rapid carrier quenching due to stimulated emission.

