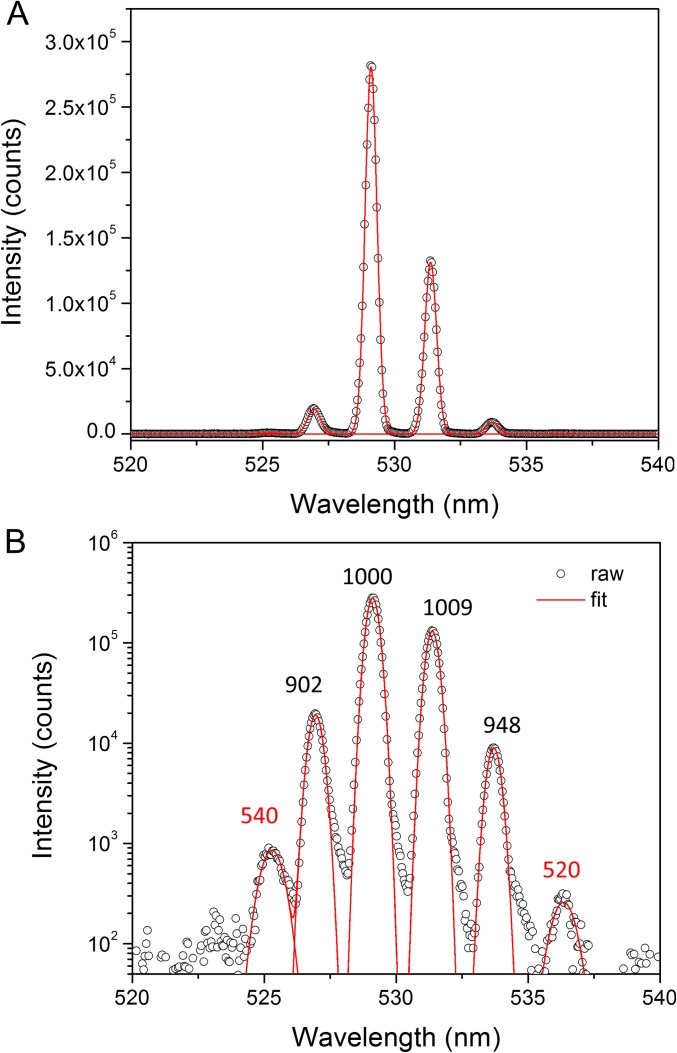
Fig. S6.
Q-factor analysis of a CsPbBr3 nanowire. (A) A linear plot of the emission spectrum at 10.3 µJ cm−2 from Fig. 2E is shown with Gaussian fits of each lasing mode. The spontaneous emission has been subtracted for clarity and ease of fitting. (B) The same spectrum and fit plotted on a log scale showing the quality of the fit. Peak annotations correspond to the Q factor for the specific peak.

