Fig. 3.
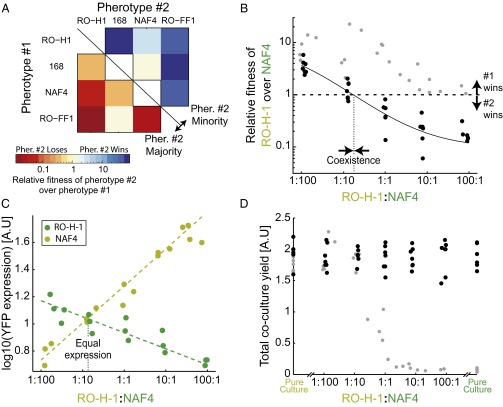
Pherotypes display negative frequency-dependent selection due to facultative cheating under swarming conditions. (A) An interaction matrix between all pairs of nonidentical pherotypes. For each pherotype pair, either pherotype 1 (bottom left) or pherotype 2 (top right) was inoculated as a minority. Each colored square marks the relative fitness of pherotype 2 over pherotype 1, according to the color bar. Strains used are AES3005 (pherotype RO-H-1), AES2355 (pherotype 168), AES3003 (pherotype NAF4), and AES3530 (pherotype RO-FF-1). (B) Shown in black circles are the relative fitness values of the RO-H-1 pherotype over the NAF4 pherotype for varying initial ratios of RO-H-1:NAF4 (strains AES3005 and AES3004). The solid black line serves as a guide to the eye. For comparison, the data of Fig. 2B are redrawn on the same scale and shown as gray circles (note that for these data points, the x axis is the ΔcomA:wild-type frequency ratio). (C) Average per cell YFP gene expression of the PsrfA-YFP reporter inserted into the chromosomes of RO-H-1 (light green, coculture of AES3012 and ASE3009) or NAF4 (dark green, coculture of AES3011 and AES3010) strains. Expression was measured at the end of swarming for cocultures with varying initial ratios of the RO-H-1 and NAF4 strains. (D) Final cell yield of swarming cocultures with varying initial ratios of the RO-H-1 and NAF4 pherotype strains (black circles). Yields were also measured for pure cultures of the two strains. As in B, gray circles are a representation of the data of Fig. 2B on the relative scale and serve for comparison. Each data point in B–D represents a measurement from a different swarming plate. Experiments were done on multiple days.

