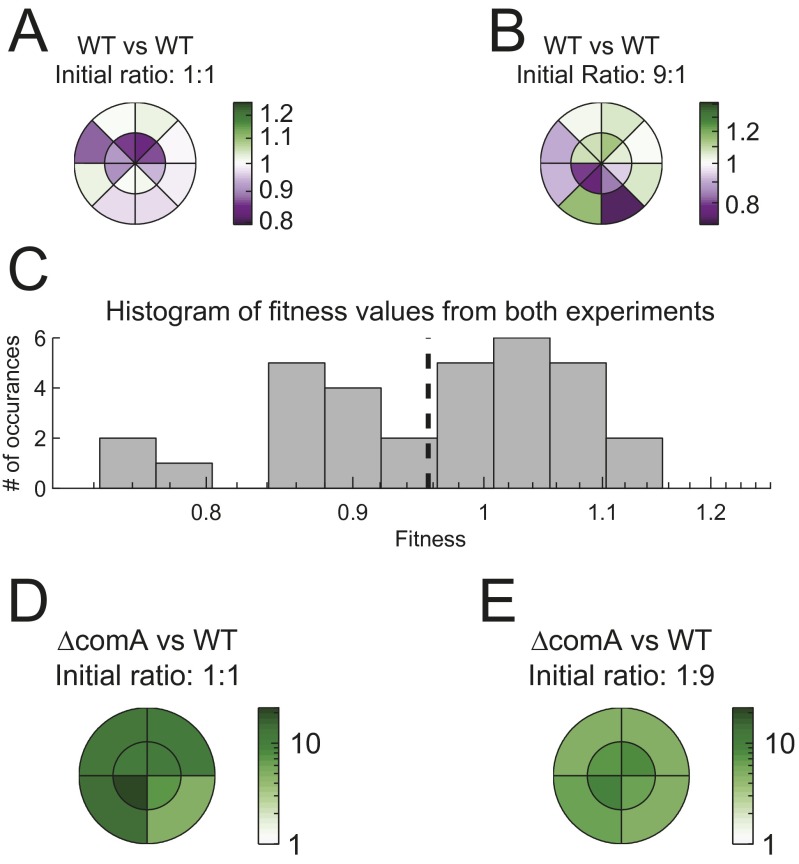
Fig. S3.
Spatial distribution of genotypes during swarming of coculture. (A and B) Two differentially marked wild-type strains (AES2030 and AES2137), harboring both a YFP and an RFP marker or only YFP, are inoculated at (A) 1:1 and (B) 9:1 ratio on separate swarming plates. Sixty-five hours after the initiation of swarming, 16 samples were taken from different positions of the swarm. Samples were taken at two different radii and at eight different angular positions, as marked in A and B. For each position we calculated the apparent relative fitness between strains, which is defined as the local relative frequency in the sample divided by the relative frequency of the inoculum at the beginning of the experiment. The color bar marks the deviation from zero fitness difference. (C) A histogram of all apparent fitness difference measurements. The mean of the histogram is −0.977 ± 0.0186 (mean ± SE), which is not significantly different from 1 difference (t test, P = 0.1 for mean = 1). The SD, σ = 0.048 sets the limit for our ability to distinguish between real selection and apparent selection during swarming. (D and E) The same as in A and B, but for a coculture of ΔcomA (AES3002) and the wild type (AES2030), with an initial ΔcomA frequency of (D) 50% and (E) 10%. ΔcomA has a significant growth advantage over the wild type everywhere.

