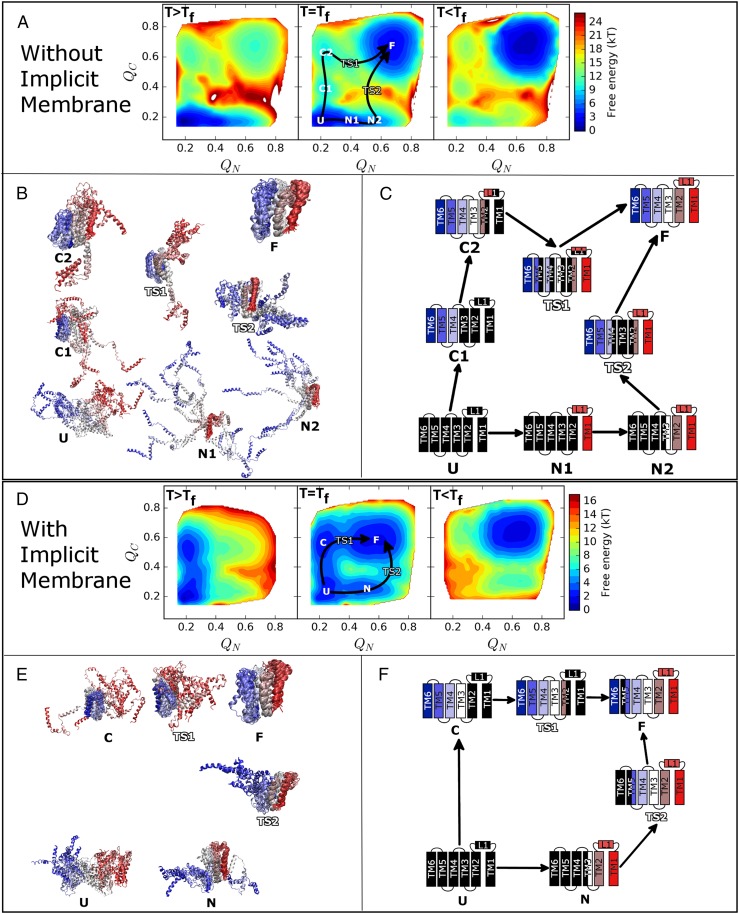
Fig. 3.
Free-energy analysis and structural characterizations of GlpG without (A–C) and with (D–F) the implicit membrane. (A and D) Two-dimensional free-energy profiles above (Left), at (Center), and below (Right) the folding temperature (Tf) with respect to QN and QC. QN and QC measure the degree of folding within the N- and C-terminal domains, respectively. Precise definitions are given in the Supporting Information. Key structural states are labeled, and the inferred folding pathways are indicated with arrows. Areas shown in white are high in free energy. (B and E) Structural ensembles made up of 10 representative structures selected from low free-energy basins and transition states; folded regions in each ensemble have been aligned for clarity. (C and F) Schematic representations of the structural ensembles. Transmembrane helices and the large loop L1 are shown as fully folded (full color), partially folded (half color), or unfolded (black). The colors used in B, C, E, and F are the same as those established in Fig. 2.

