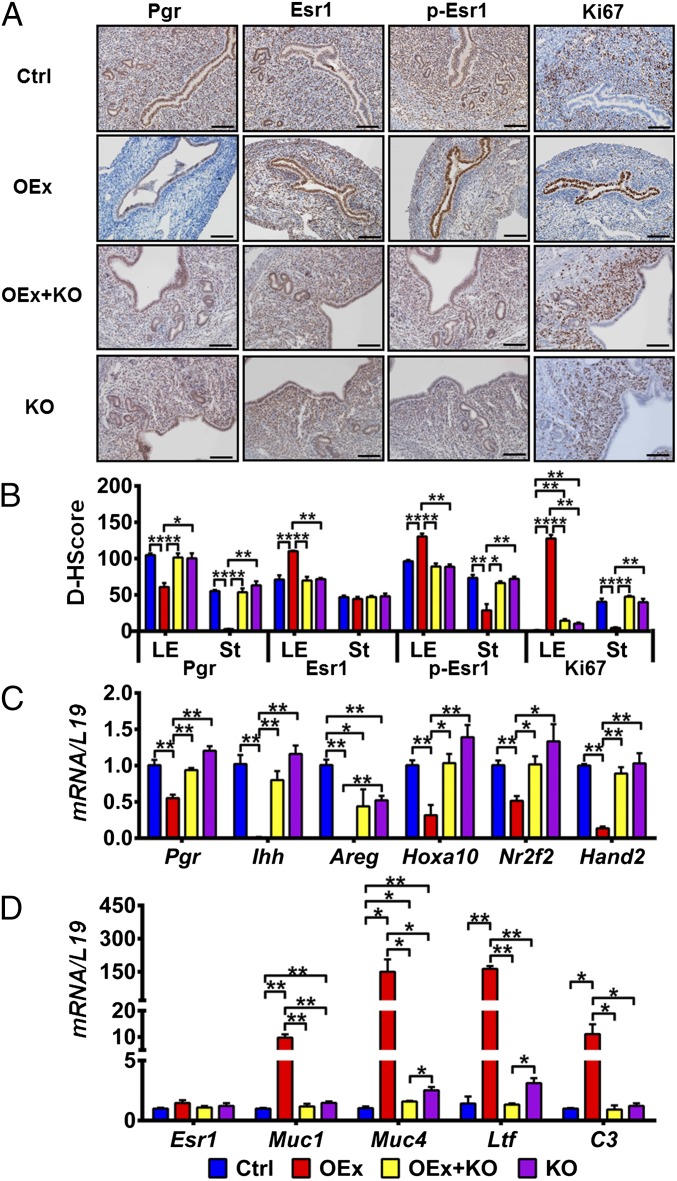
Fig. 3.
Dysregulation of P4 and E2 signaling and proliferation pattern in N1ICD OEx mice at 3.5 dpc. (A) Immunohistochemistry shows that the expression patterns of Pgr, Esr1, p-Esr1, and Ki67 (proliferation marker) are altered in N1ICD OEx mice compare with control, OEx + KO, and KO mice. Quantitative expression levels of these proteins are shown in B. (C) mRNA levels of Pgr together with P4 target genes Ihh, Areg, Hoxa10, Nr2f2, and Hand2 are significantly decreased in OEx mice compared with control mice but rescued, at least partially, in OEx + KO mice. Expression levels in KO mice are similar to those of OEx + KO mice. (D) Quantitative PCR expression of Esr1 has no significant difference among the four different genotypes of mice, but E2 targets Muc1, Muc4, Ltf, and C3 are dramatically up-regulated in OEx mice compared with control mice. The up-regulation of E2 targets is abolished in OEx + KO mice (n = 3–4 in each group). Ctrl, control; D-HScore, digital HScore; St, stroma. *P < 0.05; **P < 0.01. (Scale bar: 100 µm.)

