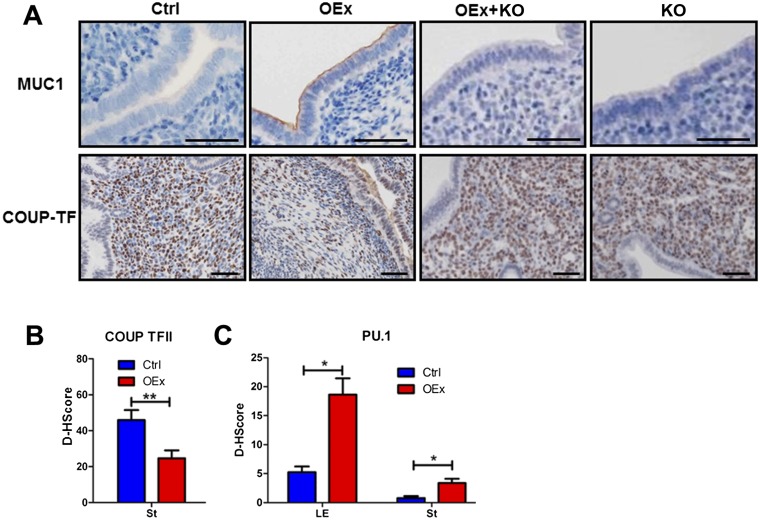
Fig. S3.
Dysregulation of P4 and E2 signaling in N1ICD OEx mice at 3.5 dpc. (A) Immunohistochemistry identifies up-regulation of Muc1 expression and down-regulation of COUP-TFII in OEx mice at 3.5 dpc. Expression of these two proteins was not different in OEx + KO and KO mice compared with control mice. (B) Quantitative expression level of COUP-TFII in the control and OEx mice shown in B. (C) Quantitative expression level of PU.1 immunohistochemistry in control and OEx mice, which are shown in Fig. 4B (n = 3–4 in each group). Ctrl, control. *P < 0.05; **P < 0.01.

