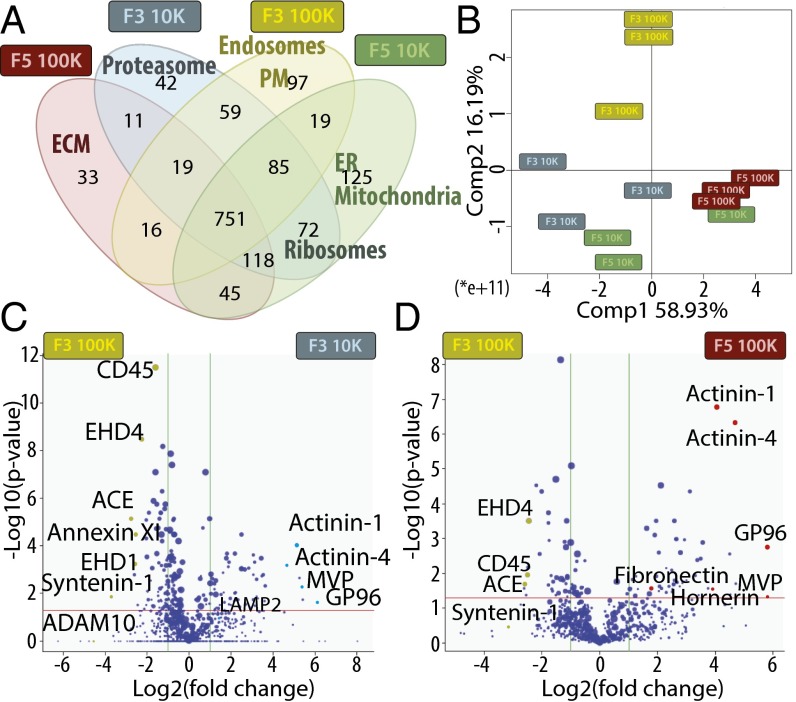
Fig. 3.
Qualitative and quantitative proteomic analyses of iodixanol fractions F3 and F5 from 10K and 100K pellets by LC-MS/MS suggest different intracellular origins of the four types of EVs, and identify potential specific proteins. (A) Venn diagram showing the distribution of proteins qualitatively identified in each fraction by at least three peptides in one of the three biological replicates. GO terms of protein families specifically enriched in a single fraction (or in two fractions for ribosomes), as determined by DAVID software, are shown. (B–D) Quantitative analysis of the amount of proteins in each fraction compared with F3-100K was performed (proteins displaying missing values among fractions were excluded from this analysis). (B) PCA analysis of the quantitative comparison shows a clear separation of fraction F3-100K from the three others. (C and D) Quantitative analysis of proteins present in F3-10K (C) or F5-100K (D) compared with F3-100K is shown as Volcano plot. x axis = log2(fold-change) (10K/100K), y axis = −log10(P value). The horizontal red line indicates P value = 0.05, vertical green lines indicate absolute fold-change = 2. Data represent results of three independent sets of donors pooled together. Position of proteins selected as potential specific markers of each fraction and analyzed further is shown.

