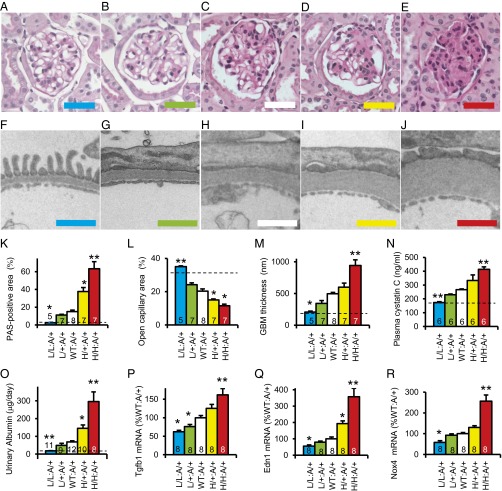
Fig. 3.
Renal pathology in the Akita diabetic mice having five graded expression levels of Elmo1 at 40 wk of age. Dotted lines indicate nondiabetic WT levels. *P < 0.05, **P < 0.01 vs. Elmo1 WT. (A–E) Periodic acid–Schiff (PAS) staining with hematoxylin of the glomerulus in 40-wk-old male mice. (Scale bar: 50 μm.) (F–J) Transmission electron microscopy of the glomerular basement membrane in 40-wk-old male mice. (Scale bar: 1 μm.) (A and F) L/L Akita mouse. (B and G) L/+ Akita mouse. (C and H) WT Akita mice. (D and I) H/+ Akita mouse. (E and J) H/H Akita mouse. (K) Quantification of PAS-positive mesangial material per total glomerular tuft cross-sectional area. (L) Percentage of open capillary area per glomerular tuft. (M) Thickness of glomerular basement membrane (GBM). (N) Plasma levels of cystatin C. (O) Urinary albumin excretion. (P) Renal expression of Tgfb1. (Q) Renal expression of Edn1. (R) Renal expression of Nox4.

