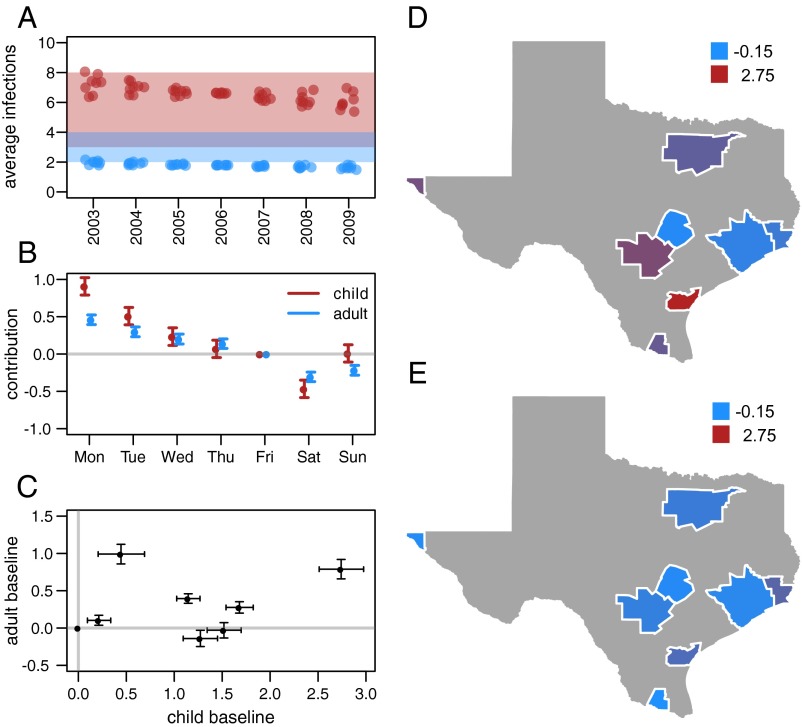
Fig. 4.
Results from the best fitting model. (A) Average number of colds in children (red points) and adults (blue points) for each of the eight metropolitan areas predicted by the model for each year of the study. The shaded windows indicate the public health estimate of three to eight colds per year for children and two to four colds per year for adults (30). (B) Estimated day of the week coefficients in the hospitalization model. Variation in these values captures, in part, variation in healthcare-seeking behavior on different days of the week. (C) Correlation of the baseline hospitalization rate in adults and children for each of the eight metropolitan areas in the study. (D and E) Baseline hospitalization rates in each metropolitan area for (D) children and (E) adults. Values represent the city-specific addition to the baseline asthma hospitalization rate. Positive values of this coefficient indicate higher baseline rate.

