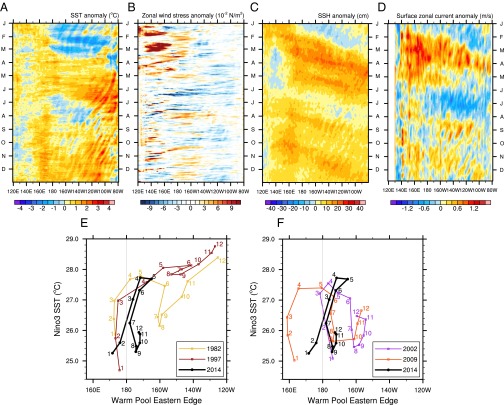
Fig. 2.
Spatiotemporal evolution of the 2014 El Niño. (A–D) Hovmöller diagrams for anomalies in (A) SST, (B) zonal wind stress, (C) SSH, and (D) surface zonal currents in the equatorial Pacific. Time goes downward. The SSH and surface velocity plots highlight the eastward propagating downwelling Kelvin waves, especially pronounced early in the year, and a strong upwelling Kelvin wave midyear. (E and F) El Niño development in 2014 (black line) compared with several historical (E) EP and (F) CP events. The diagrams show the position of the Warm Pool Eastern Edge (degrees of longitude) vs. the Niño3 SST (degrees Celsius) for different months of the year. The Warm Pool Eastern Edge is defined as the position of the 29 °C isotherm at the equator. Numbers indicate monthly averages (1, January; 2, February, etc.). The light vertical line marks the Dateline. In 2014, both the warm pool displacement and Niño3 SST anomalies were exceptionally large during May (month 5), were similar to those in 1997 and 1982 (the strongest events of the 20th century), and then, rapidly decreased by August (month 8).

