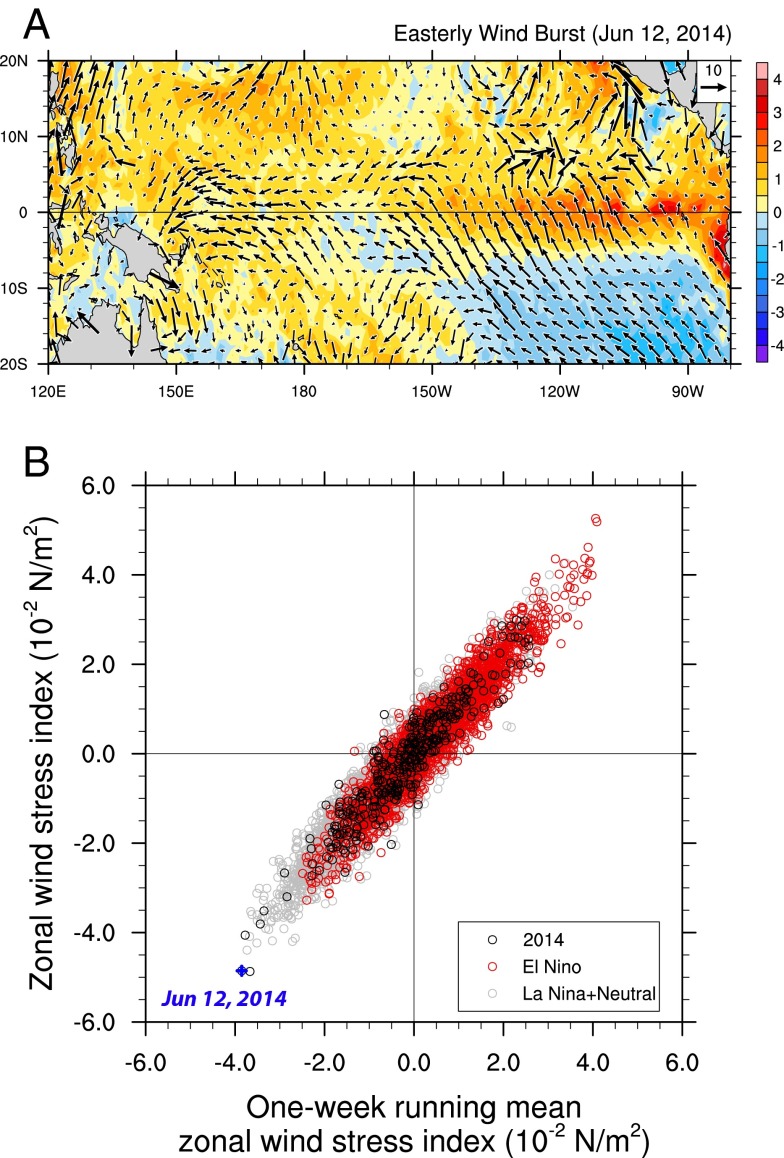
Fig. 3.
The June of 2014 EWB in satellite-based data. (A) The spatial structure of anomalies in surface winds (vectors; in meters per second) and SST (colors; in degrees Celsius) on June 12, 2014, when the burst was strongest. (B) Daily vs. weekly mean values of the zonal wind stress index (10−2 newtons per meter2) for the period 1988–2014. The blue cross marks the peak value of the June of 2014 EWB. The wind stress index is defined as anomalous zonal wind stress averaged in the equatorial Pacific zonally and between 5 °S and 5 °N (Materials and Methods). Black circles are for the year 2014, red circles are for all El Niño years before 2014, and gray circles are for all other years (La Niña or neutral). Note that the June of 2014 EWB appears strongest in the satellite record for not only daily data but also, weekly averaged values, which confirms that the observations are robust.

