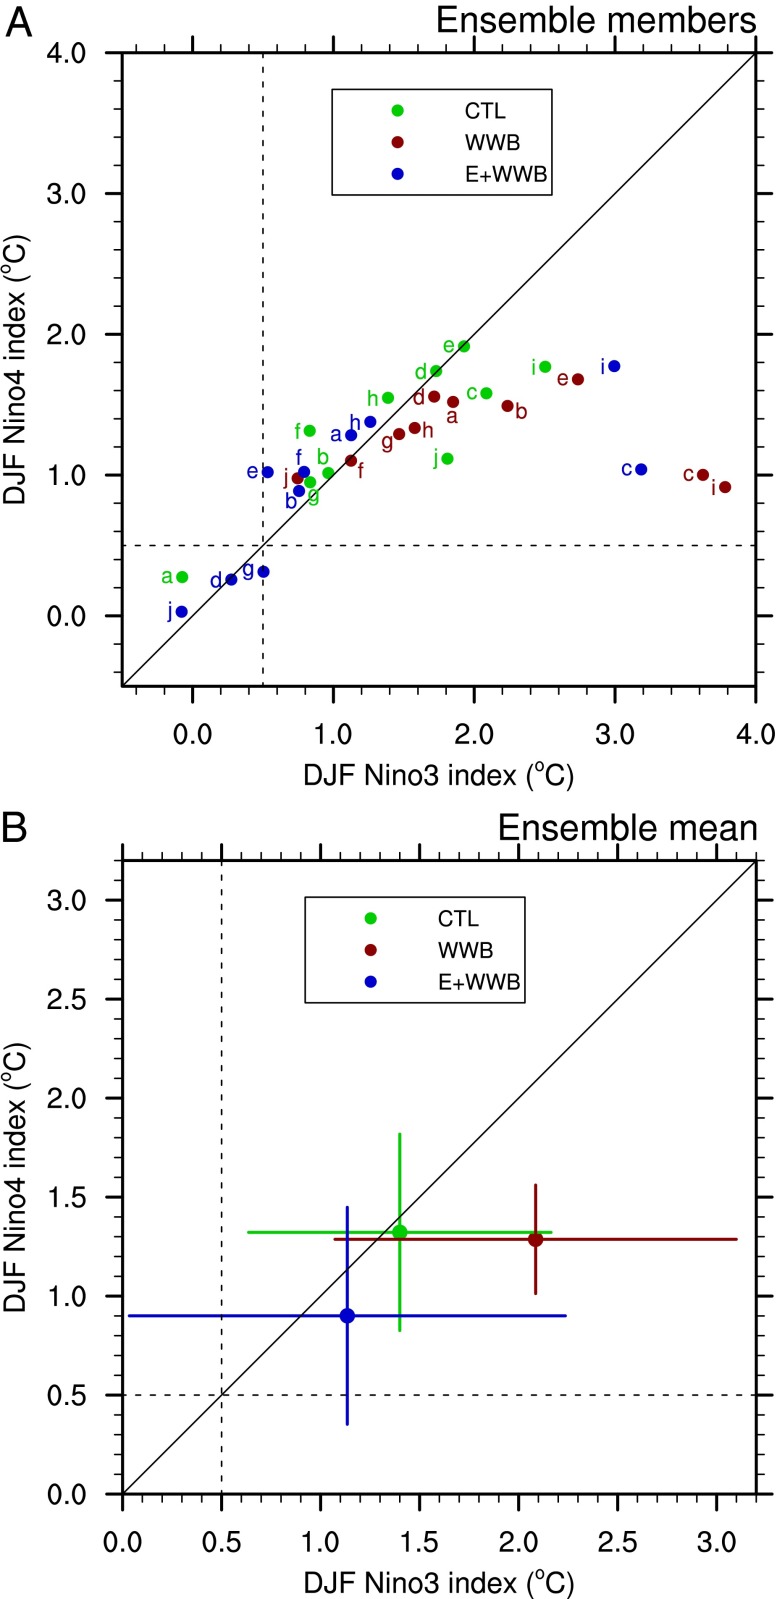
Fig. 4.
Results of numerical experiments with superimposed wind bursts. The diagrams show the Niño4 index vs. the Niño3 index at the peak of warm events in different experiments for (A) individual ensemble members, and (B) ensemble means with bars indicating 1 SD for CTL (green), the WWB (red), and the E+WWB (blue) sets. Imposing the WWBs generally intensifies El Niño. Note the two extreme events with the Niño3 index above 3.5 °C in the WWB set. Imposing the EWB reduces the El Niño strength in the ensemble mean sense as well as for most of the individual events. Because of the stochastic nature of the system, there is an overlap between different experimental sets. The Niño indices are averaged from December to February (DJF). Dashed lines mark the 0.5 °C threshold.

