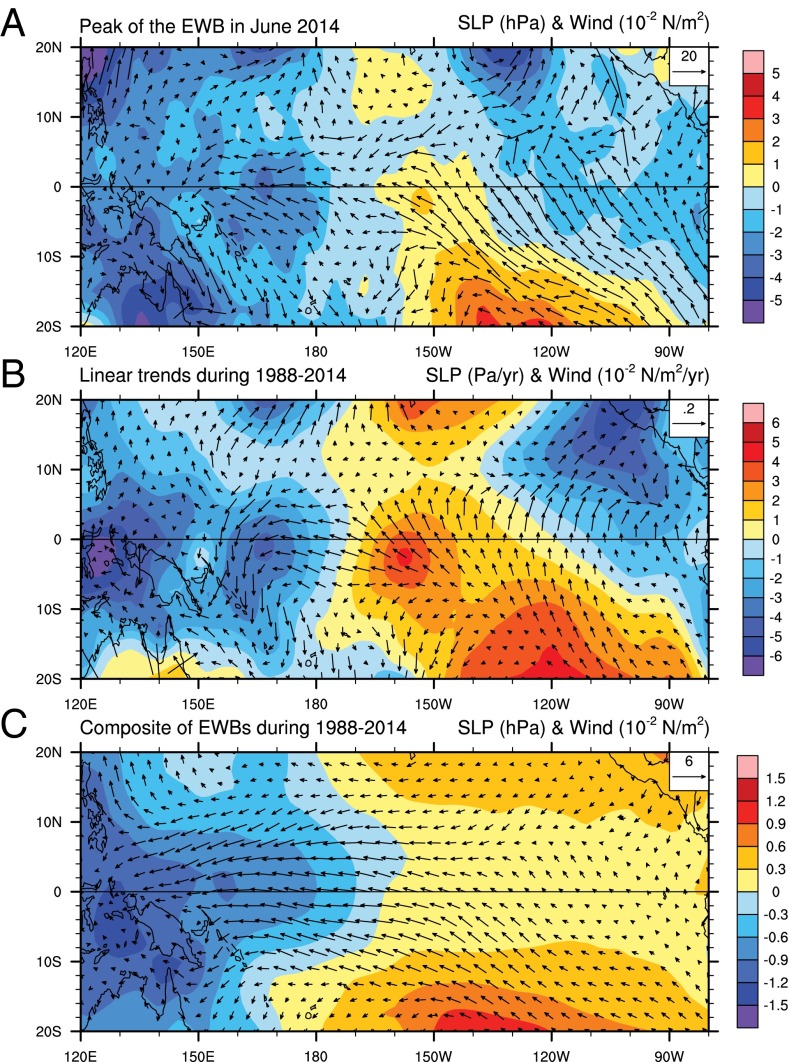
Fig. 5.
Intraseasonal wind bursts and decadal climate change. Anomalies in wind stress (vectors; 10−2 newtons per meter2 or 10−2 newtons per meter2 per year for trend) and sea level pressure (SLP; colors; hectopascals or pascals per year for trend) showing (A) the June of 2014 EWB, (B) the linear trend during 1988–2014, and (C) a composite of EWBs during the same time interval. The EWB composite is computed using a threshold of −1.25 × 10⁻² N/m2 (SD of the full time series) for the daily zonal wind stress index (Materials and Methods and Fig. 3B). Note the general agreement between the spatial patterns describing the EWBs and the decadal wind stress trend; for example, the spatial correlation of SLP patterns in A and B within 10 °S and 10 °N is above 0.8. Ref. 7 attributed the global warming hiatus to the strengthening of the easterly winds seen in B.

