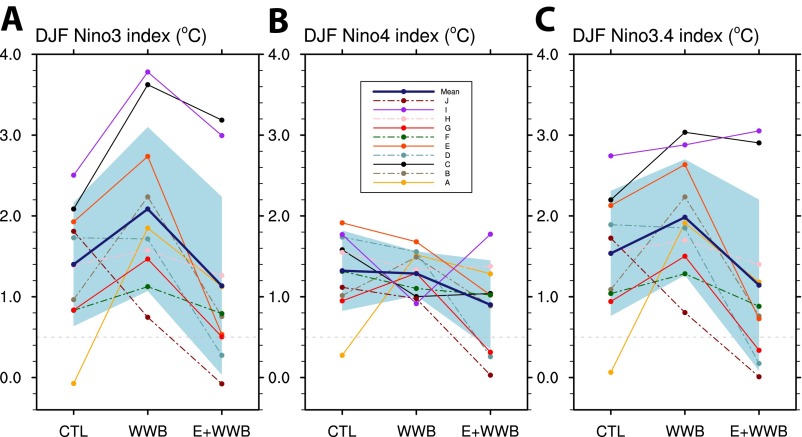
Fig. S9.
The effect of the imposed wind bursts on the El Niño amplitude. The plot shows (A) Niño3, (B) Niño4, and (C) Niño3.4 indices averaged from December to February (DJF) at the peak of warm events in different experiments. Thin colored lines show individual ensemble members; thick blue lines show ensemble means, with shading indicating 1 SD. The horizontal dashed line marks +0.5 °C—the value typically used to define El Niño. Note that, typically, El Niño amplitude increases if the two WWBs are imposed but decreases by 1 °C or more when the EWB is added next.

