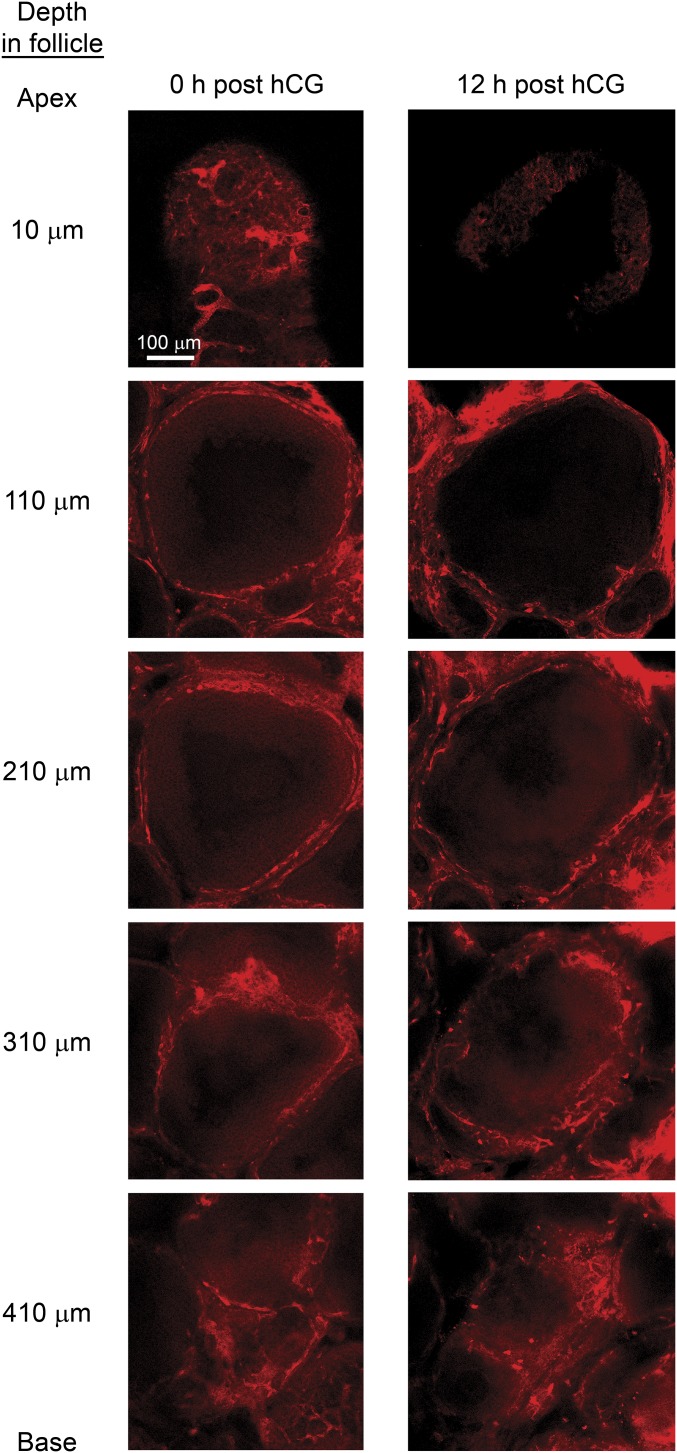
Fig. S5.
Images of the vasculature throughout representative preovulatory follicles at 0 (Left) and 12 (Right) h after hCG injection. Ovaries were harvested from mice 5 min after retro-orbital injection of rhodamine dextran and were processed to reduce light scattering and to enable deep imaging through the follicle according to the SeeDB optical clearing procedure as described in SI Materials and Methods. The topmost images, at a depth of 10 µm, are within the apical regions of the follicles and show the presence of filled vessels at 0 h after hCG injection and the absence of filled vessels at 12 h after hCG injection. Images from lateral and basal areas shown at progressively deeper positions within the follicles (110–410 µm) indicate that filling of vessels, representing blood flow, is present in these areas at both 0 h and 12 h after hCG injection. Two follicles from each of three mice were analyzed at each time point. Representative z-stack projections of apical and basal regions of follicles are shown in Fig. S6.

