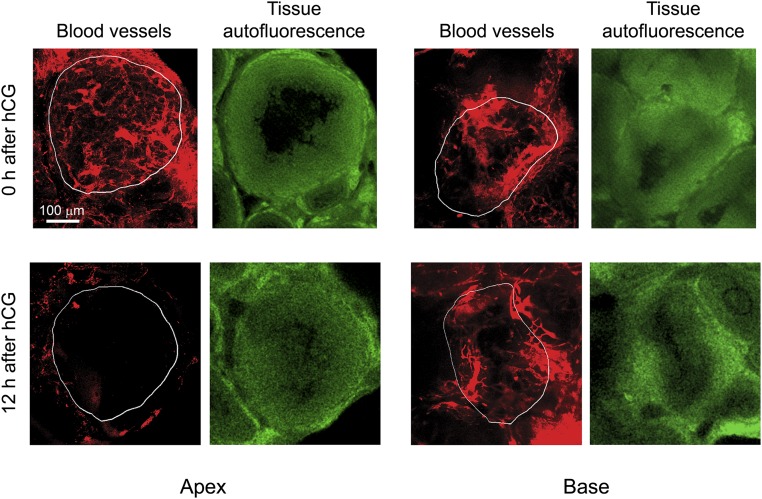
Fig. S6.
Representative z-stack projections of rhodamine dextran-filled vessels at the apex and base of preovulatory follicles in optically cleared ovaries processed as described in the legend to Fig. S5. Z-stack projections were prepared from 29 sequential multiphoton microscopy images at 3.52-μm intervals at both the apex and the base. These projections represent 100-μm-thick sections from the apex and base of the follicle. The red images show the projection of rhodamine dextran-filled vessels. The green images are single frames from the z-stack 100 μm from the base or apex showing autofluorescence of the tissue which was used to identify follicle boundaries (outlined in white on the red projections). At 0 h after hCG injection, filling of vessels was similar at the apex and base, but at 12 h after hCG injection filling at the apex was decreased relative to the base. These images were used to quantify the percent of rhodamine dextran-filled vessels at the apex and base and are discussed in Results in the main text.

