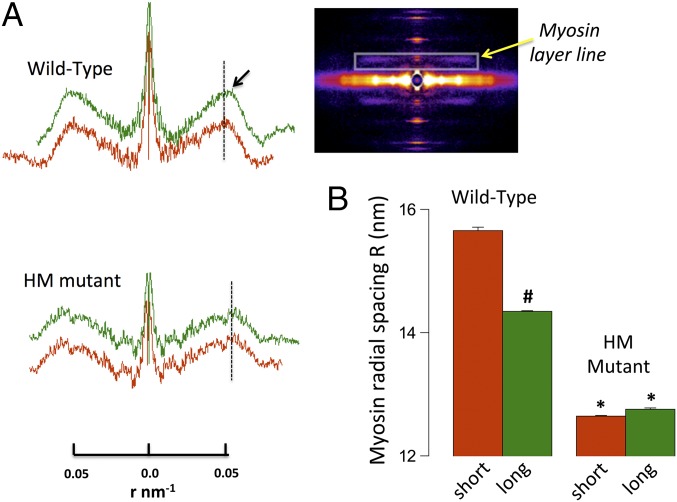
Fig. 3.
Myosin layer line analysis. (A) Myosin layer line projections in WT and HM muscle at short and long SL scaled to radial spacing r (in nm−1); the black arrow highlights the smaller radial spacing in the WT upon stretch. (Inset) Myosin layer line position (yellow arrow). (B) Average calculated cross-bridge radial spacing (#P < 0.05 long vs. short; *P < 0.05 WT vs. HM).

