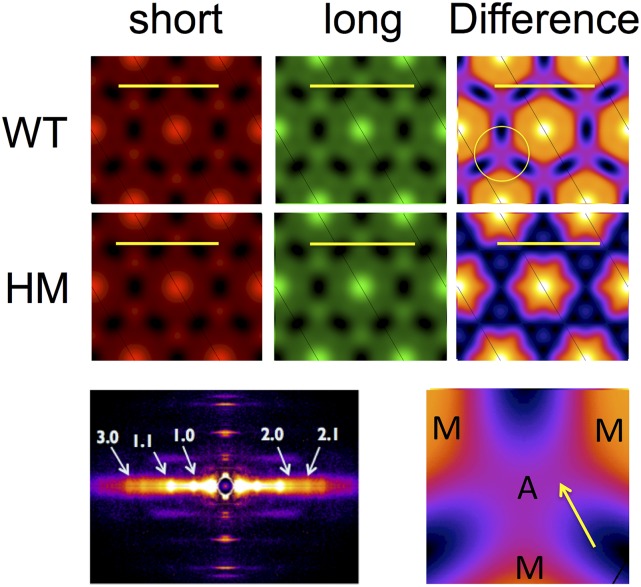
Fig. S3.
Alternative phase ED maps. ED maps were calculated using an alternative phase combination (++−++) as described in SI Materials and Methods. The overall features of these maps are qualitatively similar to the features shown in Fig. 5. However, one feature of these maps is, to our minds, an unrealistically high ED for the thick-filament backbone. When one calculates the ratio of the thick- and thin-filament EDs, however, one gets very similar relative changes as observed with the original phases (main text). Furthermore, bridging density from the thick to thin filaments is still observed in difference maps in WT muscle and not in HM muscle. A, thin filament; M, thick filament. (Calibration bar, 50 nm.)

