
. 2015 Oct-Dec;4(4):546–550. doi: 10.4103/2249-4863.174285
Copyright: © 2015 Journal of Family Medicine and Primary Care
This is an open access article distributed under the terms of the Creative Commons Attribution-NonCommercial-ShareAlike 3.0 License, which allows others to remix, tweak, and build upon the work non-commercially, as long as the author is credited and the new creations are licensed under the identical terms.
Figure 1.
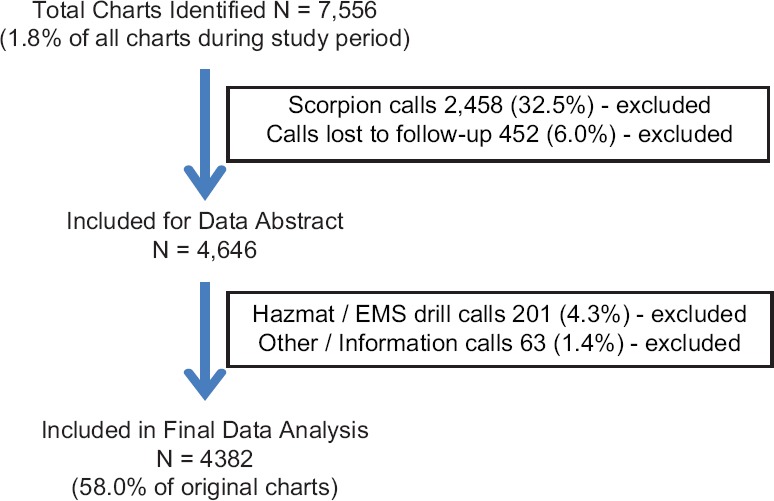
Total charts and exclusion criteria