Figure 4.

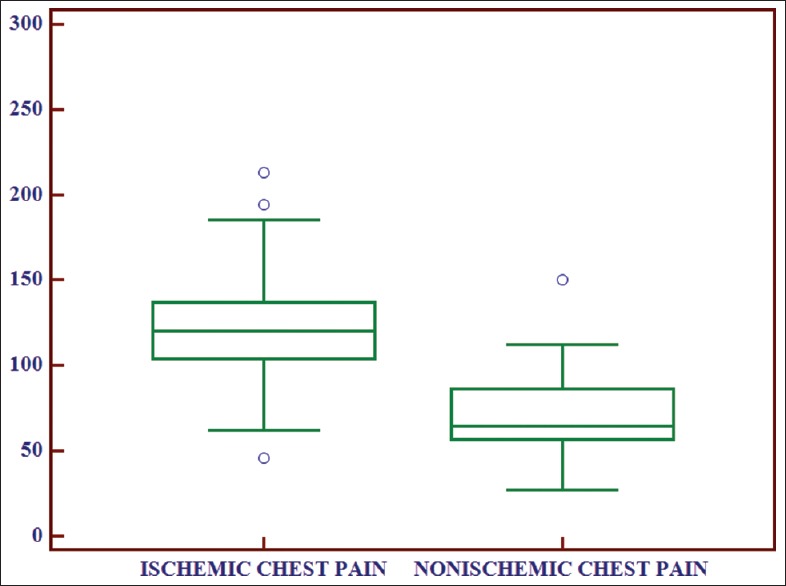
Box and whisker plot showing comparison of ischemia modified albumin levels between ischemic chest pain and nonischemic chest pain group

Box and whisker plot showing comparison of ischemia modified albumin levels between ischemic chest pain and nonischemic chest pain group