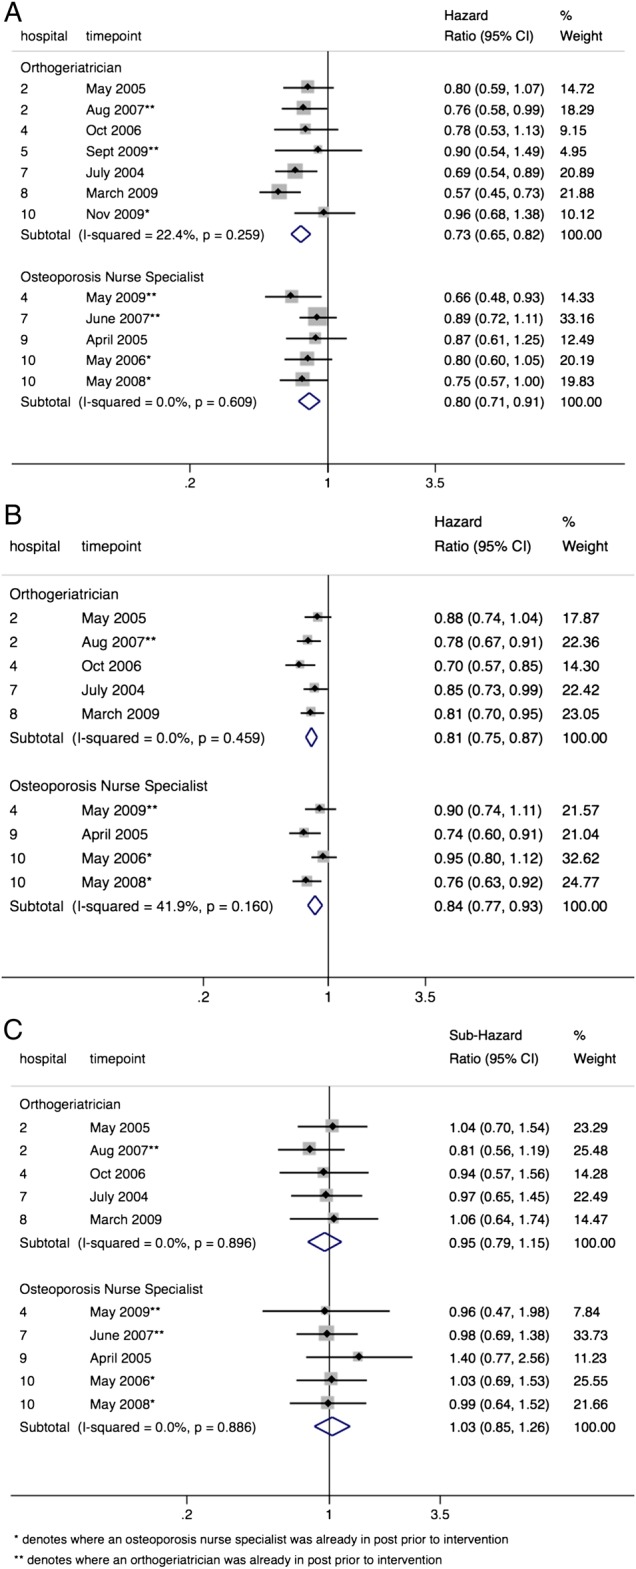
Figure 2.

Forest plot of hazard ratios for outcomes within each hospital, comparing the time period after relative to the time period before orthogeriatric or FLS service model interventions for (A) mortality within 30 days, (B) mortality within 1 year and (C) second hip fracture following primary hip fracture.
