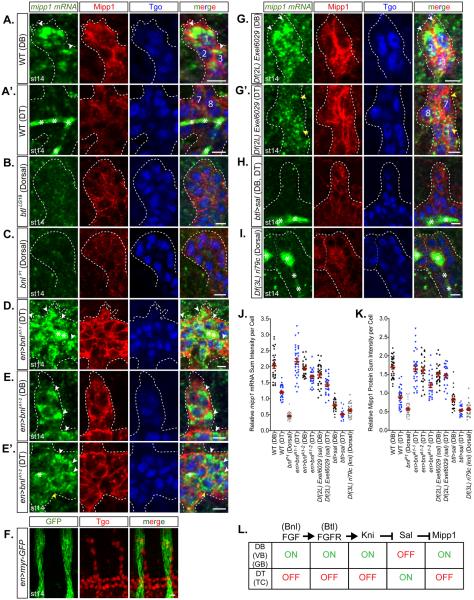
Figure 4. Expression of mipp1 is activated by FGF signaling and repressed by Spalt.
Fluorescent in situ hybridization of mipp1 mRNA (green) with immunostaining of Mipp1 protein (red) and tracheal nuclear Tgo (blue). The three DB cells located at most distal tip are labeled with 1, 2, and 3. The two DT cells located at the base of DB are labeled with 7 and 8.
(A-A’) WT st14 DB and DT.
(B-C) btl (FGF receptor null) (B) and bnl (FGF ligand null) (C) mutant st14 dorsal trachea. (D-E’) bnl overexpression st14 DB and DT.
(F) en-Gal4 driven myr-GFP expression relative to trachea. (G-G’) sal deficient st14 DB and DT.
(H) kni and knrl deficient st14 dorsal trachea.
(J-K) Quantification of the relative mipp1 mRNA and Mipp1 protein sum intensity per cell for DB and DT using Imaris. Error bars = SEM
(L) Model of the upstream pathway regulating the Mipp1 expression in trachea. * = trapping of green mipp1 signals in the tracheal lumen; white arrowheads = large foci of mipp1 mRNA; yellow arrowheads = small puncta of mipp1 mRNA; white dash lines = outline of the trachea; scale bars = 5µm.

