
Figure 1.
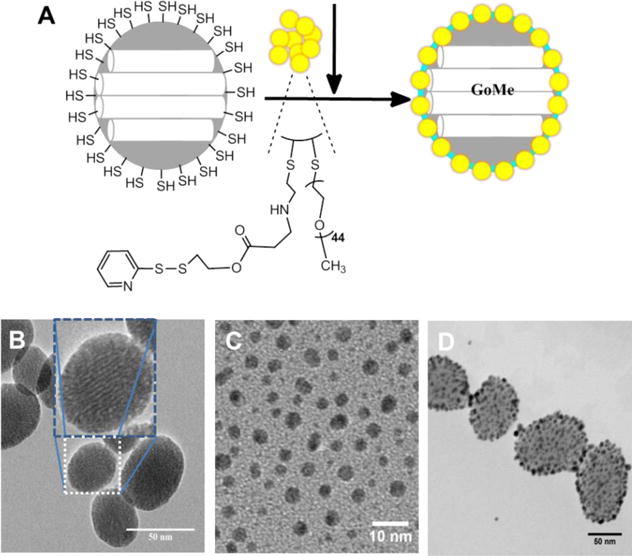
(A) Schematic illustration of the fabrication of GoMe, and TEM images of MSN (B), PEG-GNS (C), and GoMe nanoparticles (D). Scale bars are 50, 10, and 50 nm in (B), (C), and (D), respectively. The inset in (B) shows the TEM image of one individual MSN.