
Figure 16.
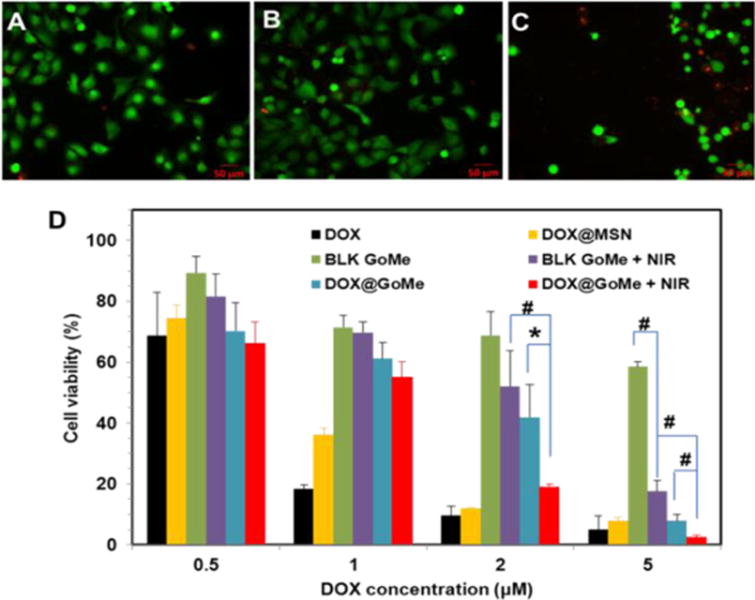
The fluorescent images of live/dead cell assay (A–C) after NIR irradiation and the cytotoxicity of DOX@GoMe coupled with NIR irradiation (D). Cells in A, B, and C were treated with blank medium, blank GoMe, and GoMe coupled with NIR irradiation, respectively. The laser dose was 10 min, 2.83 W/cm2. Scale bars in A–C are 50 μm. Data were presented as mean ± SD, n=3, P < 0.05 *; P < 0.01 #).