
Figure 8.
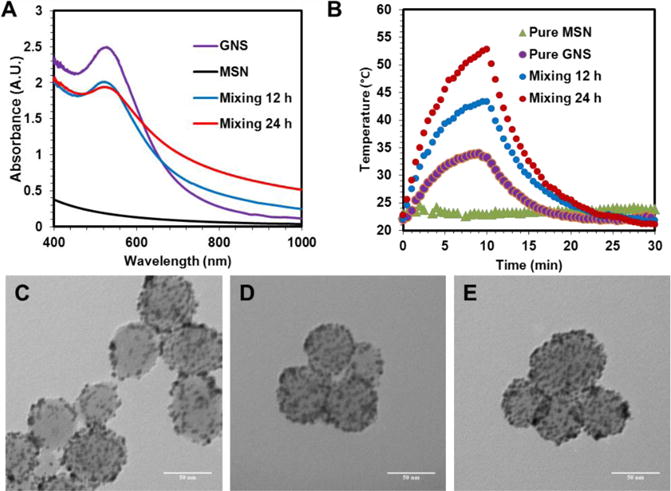
The UV-Vis spectra of GNS, MSN, and their mixture after 12 and 24 h of reaction (A), as well as their photothermal heating curves upon 10 min of 808 nm laser irradiation (2.83 W/cm2) (B). TEM images of GoMe formed after 2 (C), 12 (D), and 24 h (E) of mixing GNS and MSN. Scale bars are 50 nm in (C), (D), and (E).