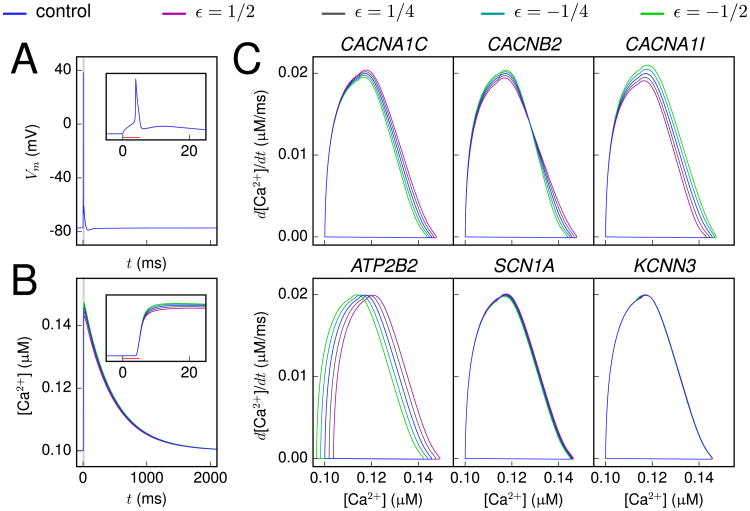
Figure 2.
Variants show altered [Ca2+] response to a short, somatic stimulus. (A, B) The membrane potential (A) and calcium (Ca2+) concentration (B) time courses, recorded at soma, as a response to a somatic 5-ms, 1.626 nA square-pulse stimulus. The blue curve shows the control neuron behavior, while the other curves show the behavior of a CAC-NA1I variant (41) with different scalings (magenta: ε = ½, dark gray: ε = ¼, cyan: ε = −¼, green: ε = −½). Inset: Zoomed-in view around the time of the spike. No notable differences between the variants and the control can be observed in the membrane potential time course. (C) The [Ca2+] response plotted in the phase plane for different variants. The behavior of variants of CACNA1C (43), CACNB2 (46), CACNA1I (41), ATP2B2 (52), SCN1A (54), and KCNN3 (62) genes are shown with similar scaling as in (A) and (B).

