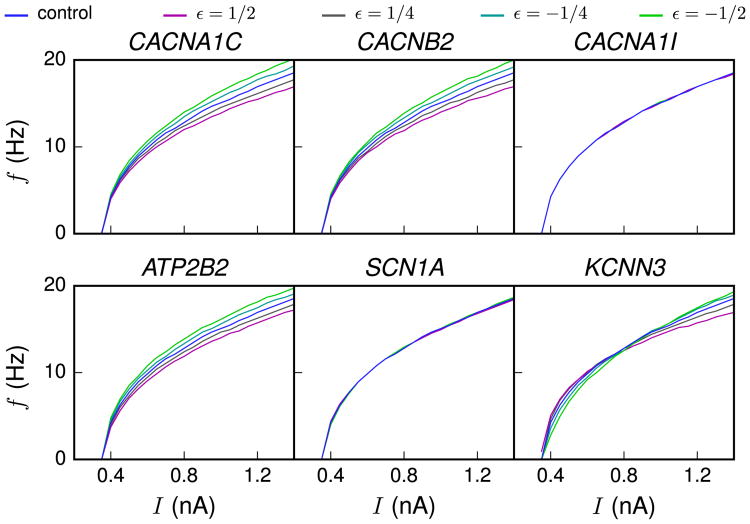
Figure 3.
The variant neurons show modulated gain. f-I curves (firing frequency as a function of direct current amplitude) are shown for different scalings of different variants (magenta: ε = ½, dark gray: ε = ¼, cyan: ε = −¼, green: ε = −½). Differences in gain are visible for CACNA1C, CACNB2, ATP2B2, and KCNN3 variants.

