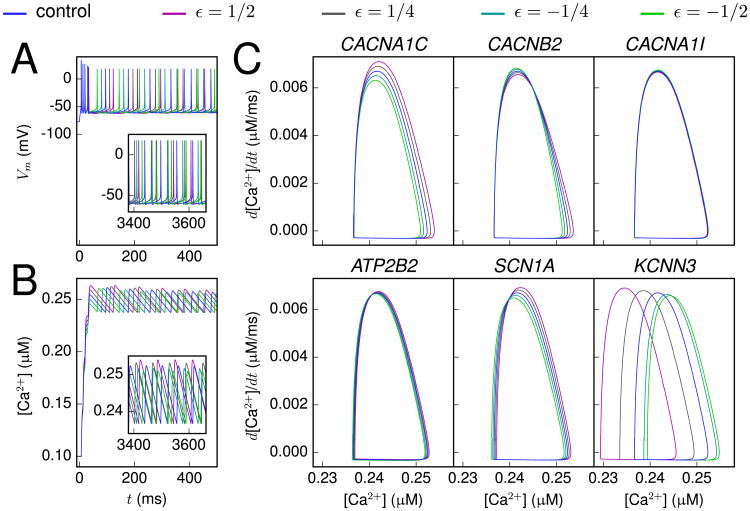
Figure 4.
Differences in [Ca2+] limit cycles of the variants. (A, B) The membrane potential (A) and calcium (Ca2+) concentration (B) time courses at soma as a response to a direct current with an amplitude of 1.2 nA. The different colors represent different scalings of a CACNA1C variant (43) (scaling as in Figure 2). Inset: The time course shown 3.4 seconds since the beginning of the stimulus. (C) The intracellular [Ca2+] phase plane during steady firing caused by a direct current applied to the soma. The variants and their scalings were chosen as in Figure 2C.

