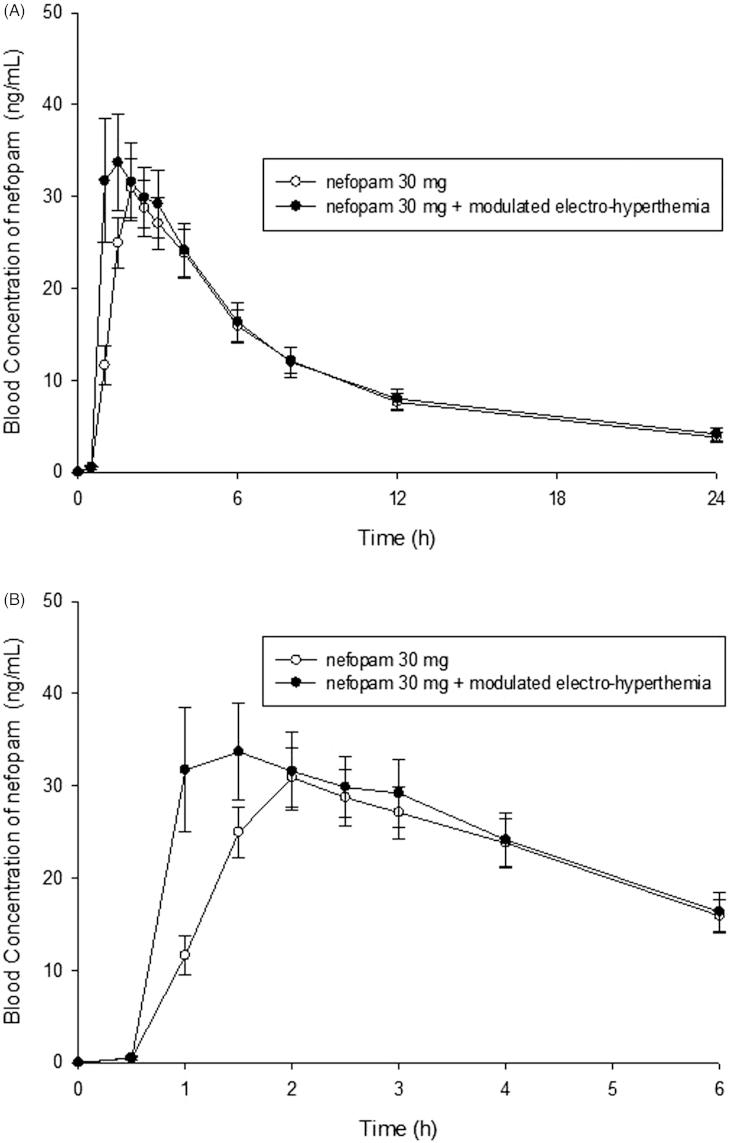
Figure 2.
(A) The mean plasma concentration-time profiles of nefopam after the uptake of nefopam alone or in combination with modulated electro-hyperthermia. The data are presented as means ± standard error. (B) The mean plasma concentration-time profiles of nefopam after the uptake of nefopam alone or in combination with modulated electro-hyperthermia from 0 h to 6 h.

