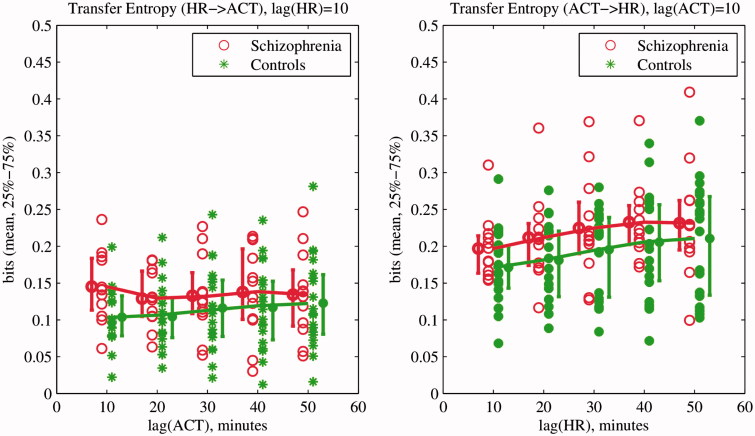
Figure 3.
First five values of transfer entropy of heart rate (HR) and activity signals of schizophrenia patients and normal controls. Transfer Entropy from HR to locomotor activity is on the left and from locomotor activity to HR on the right. Solid lines represent the fitting of a third-degree polynomial in a least squares sense into the first five TE values. Resultant coefficients are presented in Table 2.

