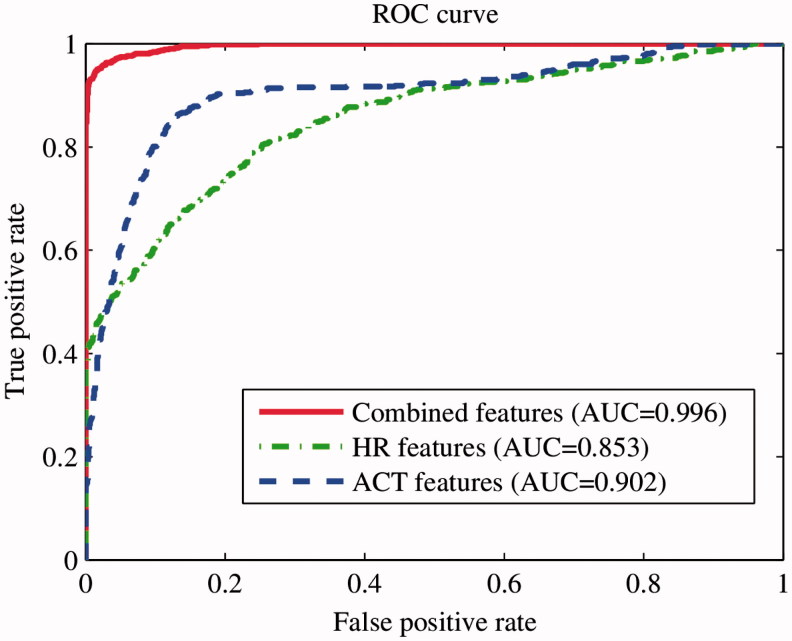
Figure 4.
ROC curves and AUC for evaluated models based on locomotor activity only (ACT features; dashed line), heart rate only (HR features; dot-dashed line) and combined HR and activity features (solid line). The AUC values are significantly different between models at a 1% significance level according to two-sided Wilcoxon rank sum test with the Bonferroni correction for multiple comparisons.

