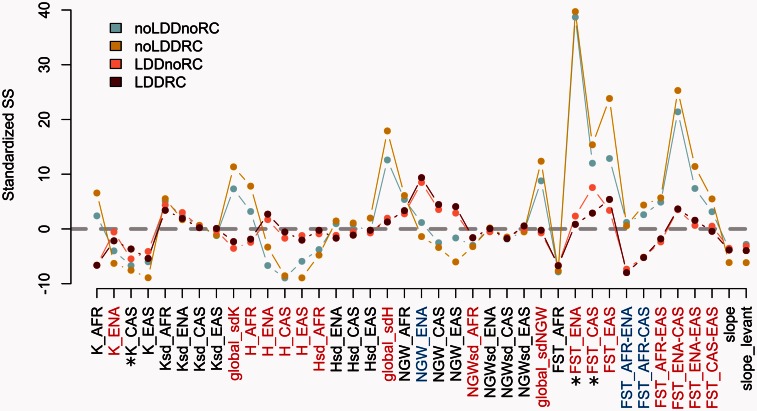
Fig. 3.
Fit between simulated and observed SSs for models noLDDnoRC, noLDDRC, LDDnoRC, and LDDRC. We report here, for each SS, the mode of the 2% simulations closest to the observations retained for posterior probability estimations. SSs were standardized using the mean and the standard deviation of each SS obtained across the 1,000 bootstrap observed data sets. Thus, SS modal values closer to zero (grey dashed line) indicate better fit to the observed SSs. The 39 SSs are fully described in supplementary table S4, Supplementary Material online. We have highlighted in red SSs where LDD scenarios were better supported by the data, and in blue SSs where no-LDD scenarios were better supported. SSs better supported by the LDDRC than by the LDDnoRC model are indicated by asterisks. All SS distributions are shown in supplementary figure S3A, Supplementary Material online.

