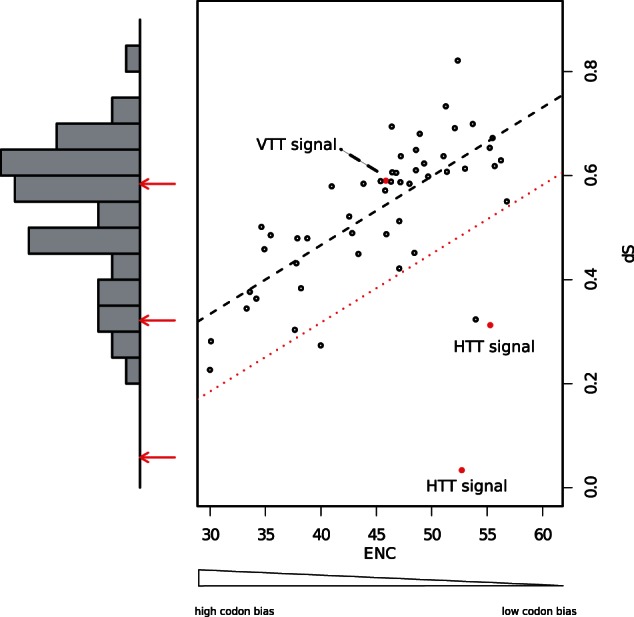
Fig. 1.

Comparison of a dS-only-based method (left bars chart) and the method proposed in this work (ENC–dS correlation graph in the right side of the figure). White circles represent the 50 host genes used as our control for vertically transmitted genetic information, red circles are the TE ENC–dS plotted against the vertically inherited host genes, the dotted black line represents the predicted distribution of the ENC–dS correlation between host genes derived from the observed data, and the dotted red line represents the variance of the observed measurements. If the TE ENC–dS red circle is plotted inside of the variance of the host data, then it is not significantly different from the host genes and it is considered vertically transmitted. On the contrary, if it is plotted far from the dotted red line it is significantly different from the host genes, hence it will be considered horizontally transferred between the two species. dS, number of synonymous substitutions per synonymous sites; ENC, Effective Number of Codons.
