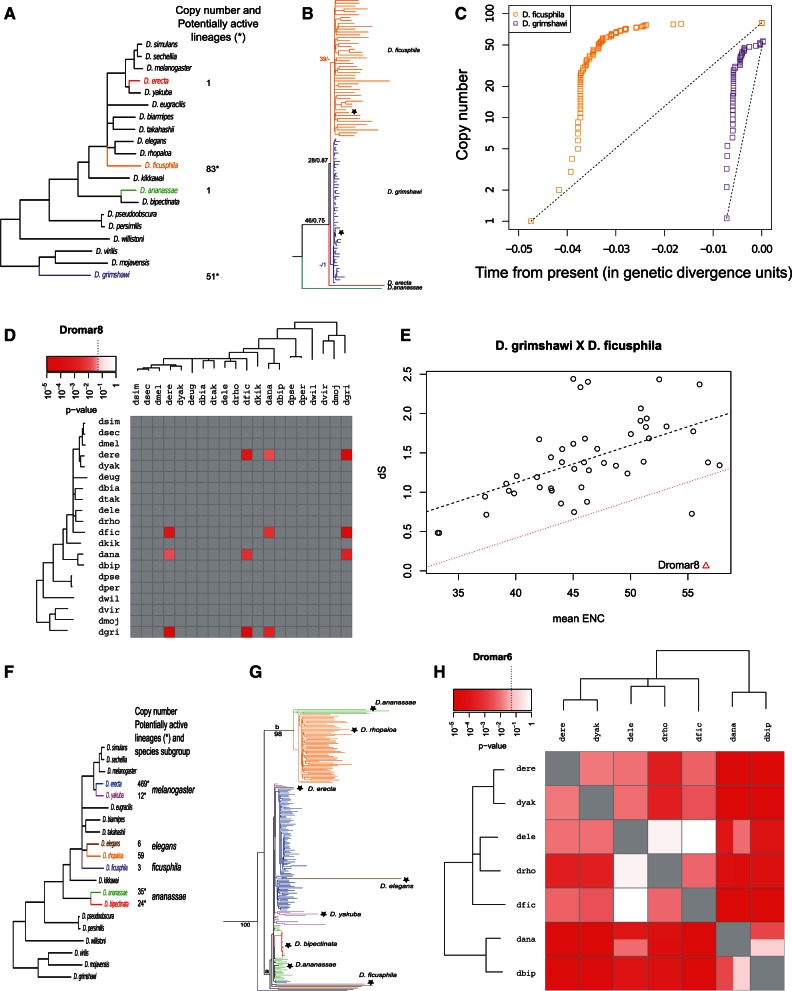
Fig. 6.
Detailed analysis for two mariner lineages: Dromar8 (A–E) and Dromar6 (F–H). (A) and (F) Distribution of Dromar8 and Dromar6 in Drosophila, with indications of copy number and lineages with potentially active copies (data from Wallau et al. 2014). (B) and (G) TE phylogenies of Dromar8 and Dromar6 with stars denoting the representative copies (Evolutionary models were HKY+I+G and TPM3uf+G, respectively). (D and H) HTT matrices generated by vhica. (E) ENC–dS plot obtained from the comparison between the two species in which Dromar8 has amplified. (C) Amplification dynamics analysis of Dromar8 in the two species with large copy numbers (see Le Rouzic et al. 2013 for a full description of the method).

