Abstract
Transfer of Pb and As into vegetables grown in orchard soils historically contaminated by Pb arsenate pesticides was measured in the greenhouse. Lettuce, carrots, green beans and tomatoes were grown on soils containing a range of total Pb (16.5–915 mg/kg) and As (6.9–211 mg/kg) concentrations. The vegetables were acid-digested and analyzed for total Pb and As using ICP-mass spectrometry. Vegetable contamination was dependent on soil total Pb and As content, pH, and vegetable species. Arsenic concentrations were highest in lettuce and green beans, lower in carrots, and much lower in tomato fruit. Transfer of Pb into lettuce and beans was generally lower than that of As, and Pb and As were strongly excluded from tomato fruit. Soil metal concentrations as high as 400 mg/kg Pb and 100 mg/kg As produced vegetables with concentrations of Pb and As below the limits of international health standards.
Keywords: lead, arsenic, soil contamination, plant uptake, vegetable, orchard
1. Introduction
Arsenic (As) and lead (Pb) have been used historically in pesticides (e.g., calcium arsenate, lead arsenate, copper arsenate) applied to orchard crops such as apples and peaches, as well as to some other crops such as potatoes. Because Pb is quite immobile, and As is only very slowly leached through soils [1, 2] the cumulative contamination of orchard soils by lead and arsenate beginning in the late 1800s persists today [3]. As old orchard lands are converted from agricultural to residential uses, the potential hazard to human health may be increased from certain exposure pathways arising from gardening and direct contact with soil. The scale of this problem is largely based on estimates that millions of acres across North America have been contaminated by arsenic and lead pesticides. Virginia may have 100,000–300,000 acres of old orchard land [3], and other states with large acreages of impacted orchard land include Washington (188,000 acres), Wisconsin (50,000 acres) and New Jersey (up to 5% of total agricultural acreage)[2]. The total area of historical soil contamination in New York state is uncertain, but apple production has occupied about 40–50,000 acres in recent decades, with a general long-term decline in orchard acreage and a simultaneous increase in yield. It seems likely, then, that the present apple crop acreage underestimates the total land area that may have been contaminated by As and Pb at some time in the past.
The potential transfer of soil Pb and As into vegetable crops is a concern when garden soils are contaminated by these toxic metals. With growing concern about dietary exposure to these two toxic elements, a number of guidelines have been developed for recommended limits of Pb and As in vegetables and other food crops. For example, the European Union has set standards for Pb at 0.1 (f.w.) for fruits and roots and 0.3 mg kg−1 (f.w.) for leafy greens. Few official standards exist at present specifically for As in vegetables, although several government agencies have recommended As limits close to 0.1 mg kg−1 (f.w.). No standards for Pb and As in vegetables, fruits or other staple food crops exist in the United States as yet.
A number of older published studies have measured As, and especially Pb, transfer into vegetables grown on historically lead arsenate-contaminated orchard soils. Generally, the degree of contamination of the edible portion of the crops was relatively small, especially for fruits [4–7]. Creger and Peryea [7] measured As in apple and apricot fruits grown in lead arsenate-contaminated soils. Although they found Pb in the fruit to be below analytical detection limits, As concentration reached as high as 70 μg/kg (fresh wt. basis) in the fruit, and was correlated to the HCl-extractable soil As (which ranged from 0 to 100 mg/kg in these soils). Thus, the degree of fruit contamination depended on strong acid-extractable soil As concentration, which is correlated to total soil As. However, leafy and root crops have shown higher levels of As and Pb contamination. In particular, the relatively high water solubility of soil As measured by a number of studies of lead arsenate-contaminated orchard soils suggests that the potential for As uptake into roots and leaf tissues of some crops could be significant. In fact, As uptake is frequently high enough to cause phytotoxicity in sensitive crops [8, 9]. McBride et al. [10] found in one greenhouse experiment that uptake of As into leafy green vegetables from severely contaminated orchard soil (containing 220 and 1300 mg/kg of total As and Pb, respectively) was relatively high (near 10 mg kg−1 As on a dry weight or d.w. basis), and substantially greater than that of Pb (about 3 mg kg−1 Pb d.w.), consistent with the much higher water solubility of As compared to Pb measured in the soil. These leafy green concentrations, when converted to approximate As and Pb concentrations on a fresh weight (f.w.) basis, exceed WHO limits for As but are somewhat below EU recommendations for Pb.
Despite the potential risk to vegetable and fruit crops grown on old orchard soils, particularly from As uptake, few recent studies of the transfer of these toxic metals from lead arsenate-contaminated soils into such crops have been published. Because of increasing awareness of the toxicity of Pb and As to humans as discussed above, and because most older studies of Pb and As uptake from orchard soils used relatively insensitive analytical methods, the present study was undertaken to measure uptake of Pb and As from an historically lead arsenate-contaminated soil into vegetables using a highly sensitive method (ICP-MS) for Pb and As analysis.
2. Materials and Methods
2.1. Properties of Soil Samples
Surface soils (0–15 cm) were sampled in October of 2009 at locations pre-selected within the Cornell Orchard to represent a wide range of total Pb and As. These soils are labeled A1, A3, A6, H11 and G6. A control soil, collected at the same time from a nearby field (Caldwell field) outside of the orchard, contained low (near-background) Pb and As concentrations. All soils are classified as Hudson series, with the same silty clay loam texture, and were selected with the expectation that they would have quite similar physico-chemical properties with the exception of their total Pb and As concentrations. The soils were-air dried, thoroughly mixed and stored in large plastic containers in preparation for the greenhouse experiment.
Soil subsamples were taken in triplicate from the containers and further ground using a mortar-and-pestle prior to analysis for total Pb and As. Measurement of pH was done in deionized water (1:1 soil/water ratio) by glass electrode, and organic matter content by the Walkley-Black dichromate oxidation method [11]. The effective CEC (CECe) of the soils was determined by measuring exchangeable base cation content (Ca+Mg+K), using the Modified Morgan extraction method (1 M ammonium acetate at pH 4.8) to dissolve the cations [12] and flame atomic absorption to measure them in the filtered extracts. Free Fe and Mn oxide contents in the orchard soils had been measured elsewhere [13], and were found to be quite low at 1.1 g kg−1 Fe and 0.12 g kg−1 Mn. Soils were digested using EPA Method 3051 and the digests were analyzed for Pb and As by ICP-OES. The measured properties of these soils are given in Table 1, with the soils ranked in the order of increasing total Pb and As.
Table 1.
Important properties and total and water-soluble Pb and As of the orchard soils. Standard deviations of mean values based on duplicate measurements are reported for CECe and total and soluble Pb and As.
| Soil | pH | CECe (mmoles/kg) | OM (%) | Total Pb (mg/kg) | Total As (mg/kg) | Soluble Pb (μg/L) | Soluble As (μg/L) |
|---|---|---|---|---|---|---|---|
| Control | 5.9 | 101 ± 2 | 2.50 | 16.5 ± 0.8 | 6.9 ± 0.5 | 2.5 ± 0.7 | 6.5 ± 0.7 |
| A1 | 5.8 | 133 ± 35 | 5.30 | 123 ± 16 | 35.8 ± 2.4 | 9.5 ± 0.7 | 19 ± 1.4 |
|
| |||||||
| A3 | 6.2 | 135 ± 9 | 4.75 | 244 ± 14 | 67.8 ± 3.8 | 57.5 ± 3.5 | 83.5 ± 3.5 |
| H11 | 4.9 | 48 ± 6 | 5.00 | 289 ± 38 | 70.6 ± 1.9 | 72 ± 17 | 35 ± 2.8 |
|
| |||||||
| A6 | 6.5 | 159 ± 11 | 5.13 | 400 ± 39 | 91.3 ± 7.9 | 20 ± 19.8 | 124 ± 7 |
| G6 | 6.2 | 174 ± 3 | 7.40 | 915 ± 149 | 211 ± 49 | 153 ± 69 | 745 ± 80 |
In order to determine the initial solubility of Pb and As in the soils listed in Table 1 prior to their use in the greenhouse experiment, about 250 g samples of soil (in duplicate) were taken from the storage containers and placed in Buchner funnel cups fitted with Whatman #42 filter papers, then brought to field capacity with deionized water. After 24 hours equilibration, pore water was collected from the soils by vacuum extraction, then put through 0.2 μm membrane filters, stabilized with 0.1 ml concentrated ultrapure HNO3, and analyzed for Pb and As by ICP-MS. The average measured soil Pb and As solubilities are listed in the last two columns of Table 1.
2.2. Greenhouse Pot Experiment
Labeled plastic pots with bottom drainage holes were filled with 5.5 kg (dry wt.) of the 6 soils, with 4 replicate pots for each soil. The soils were brought to a field-moist state with tap water, and lettuce seeds (“Simpson Elite”) were planted in the pots placed on a table in the greenhouse. Supplemental overhead lighting (12 hours/day) was provided and temperature was maintained near 21° C (day) and 10°C (night). After seedlings were established, they were thinned to about 6/pot, a plant density that resulted in a full canopy at harvest. As some evidence of N deficiency was noted after the first two weeks of lettuce growth, a small quantity of a slow-release NPK fertilizer was applied to the surface soil of each pot, equivalent to approximately 100, 15 and 50 kg/ha of N, P and K, respectively. Pots were watered when the soil was visibly dry, with care taken to minimize leaching of water through the pots.
The lettuce was harvested 40 days after planting by cutting the tops about 1 cm above the soil surface. The lettuce was carefully washed in tap water, excess water was removed, and the lettuce was dried in paper bags in the oven at 60–70°C. The dried lettuce tissues were then ground using a coffee grinder, placed in labeled whirl-pak bags, and acid-digested. The digests were analyzed for Pb and As by ICP-MS. After the lettuce harvest, the same pots were planted with carrots after a 1-month “fallow” period in early 2010 (cv. “Royal Chantenay”). After 10 weeks, the carrots were thinned to 8 plants/pot. Carrot roots were harvested after 3 months, washed and scrubbed thoroughly to remove all soil particles. The carrot roots were then divided into two sample groups, one peeled and one not peeled. All the carrot roots were then thin-sliced, dried in paper bags in the oven at 60–70°C, ground using a coffee-grinder, and stored in small labeled whirl-pak bags. Samples were digested and analyzed for Pb and As as described above for lettuce. All Pb and As concentrations in vegetable samples are reported as mg kg−1 on a dry weight basis.
The cropping sequence was continued with 1-year fallow periods for the final two crops because experience had shown the crops to grow poorly in the greenhouse during the summer months when temperature control was inadequate. Thus, bush beans (cv. “Roma II”) were planted in April 2011 and thinned to 3 plants/pot. The green bean pods were harvested at the edible stage, 54 days after planting, washed, dried, ground and analyzed for Pb and As as described above for the other crops.
The final crop, tomato (cv. “Sub-Arctic Plenty”) was planted using pre-started seedlings (1 per pot) in April 2012. A small amount of slow-release NPK fertilizer, equivalent to about 300, 45, and 160 kg/ha of N, P and K, respectively, was applied to the soil surface of each pot. Ripe tomatoes were harvested from each of pots 78 days after planting, washed, cut into pieces, dried in glass jars at 60–70°C, ground and analyzed for Pb and As as described above for the other crops.
The lowest crop yields were generally measured for the control and H11 soil, attributable to the low pH of H11 and poor structure (low organic matter) of the control (see Table 1), while the highest yields were found for A3 and G6 (data not shown). Because there was no apparent relationship of plant growth in the different soils to soil total Pb or As, attributable to the fact that soil variables other than metal content (for example, soil organic matter content) most strongly affected plant growth, it was not possible to determine whether arsenic was phytotoxic to any of the crops.
All plant tissue As and Pb concentrations are reported in the results section as mg kg-1 on a d.w. basis, although for purposes of converting these to approximate f.w. concentrations for comparison with international food guidelines, measured water contents of 94.9% (lettuce), 87% (carrots), 89% (green beans) and 94% (tomato) were used.
Data analysis included linear regression of crop As and Pb concentrations against soil total As and Pb, with the significance of regression r-values at the 5% level determined by the standard t-test. ANOVA was conducted on the data using the StatView software (SAS Institute, Cary, NC, USA) in order to determine the significance of the soil and crop type as factors in determining the concentrations of As and Pb in the edible crop tissues.
3. Results and Discussion
3.1. Soil Properties
The soils selected for the greenhouse study had a range of total Pb of 16.5 to 915 mg/kg, and total As of 6.9 to 211 mg/kg (Table 1), with the soil concentrations of the two elements being very closely correlated. Soluble Pb and As generally increased with increasing total soil Pb and As, respectively. However, soil A6 had lower soluble Pb than expected by comparison with its total Pb, which can probably be explained by the fact that A6 had the highest pH (6.5) of the studied soils. Soil H11 had lower As solubility relative to its total As concentration compared to the other soils, possibly a consequence of the low pH (4.9) of this soil, as acid conditions are expected to favor adsorption of anions such as arsenate and phosphate on soils based on their adsorption behavior on model iron oxides [14]. However, comparisons of soils with different properties have shown soil pH to be much less important than soil reactive Fe oxides in controlling arsenate adsorption [15, 16]. The low pH and exchangeable base cation content of soil H11 was unanticipated; it is suspected that the soil in the field location where H11 was sampled had been intentionally acidified in order to establish blueberry plants some years earlier.
Because soil H11 was much more acidic than the other soils used for this greenhouse study, poor growth and much higher Pb uptake were observed for most crops grown in this soil. As a result, it was decided to exclude the data for this soil from the overall comparison of Pb and As uptake over the range of soil Pb and As concentrations represented by the other soils. Fortunately, soil A3 had Pb and As concentrations similar to those of H11, so that a comparison of Pb and As uptake into the crops between these two soils provided a useful test of the effect of soil pH on phytoavailability of these metals.
Because the soils were used in a sequential cropping experiment in the greenhouse, it is very possible that solubilities of Pb and As and pH in the soils could have fluctuated from their initially measured values due to rhizosphere effects of the different crops and microbial activity. As the scope of this study did not include detailed monitoring of Pb and As concentrations in soil solution, the total Pb and As in the soil were tested as predictors of plant uptake, recognizing that these are easier to measure and are more stable over time. The soil pH values measured at the end of the cropping sequence tended to be several tenths of a pH unit higher than the initial pH values given in Table 1, but soil H11 remained substantially more acidic than the other soils.
3.2. Lettuce Crop
The concentrations of both Pb and As in the harvested lettuce increased with increasing soil concentrations of these two contaminants (Figure 1). The plant uptake coefficients (UC), defined as the ratio of crop metal concentration (mg kg−1, d.w. basis) to the soil total metal concentration (mg/kg−1) were much higher for As than for Pb, with the highest UCs for both As and Pb measured at the highest soil concentrations. Arsenic is readily taken up by leafy green crops, whereas Pb generally has a low tendency for uptake into above-ground tissues because of its very low solubility in soils that are not strongly acidic [10, 17]. However, the UC for As in leafy vegetables is strongly dependent on plant species [17]. Our (unpublished) field studies of As uptake by vegetables grown in orchard soils show lettuce to be intermediate in potential for As uptake, higher than spinach and collards, but lower than arugula (which averaged 12–13 mg/kg As when grown on soils with 60–120 mg/kg total As).
Figure 1.
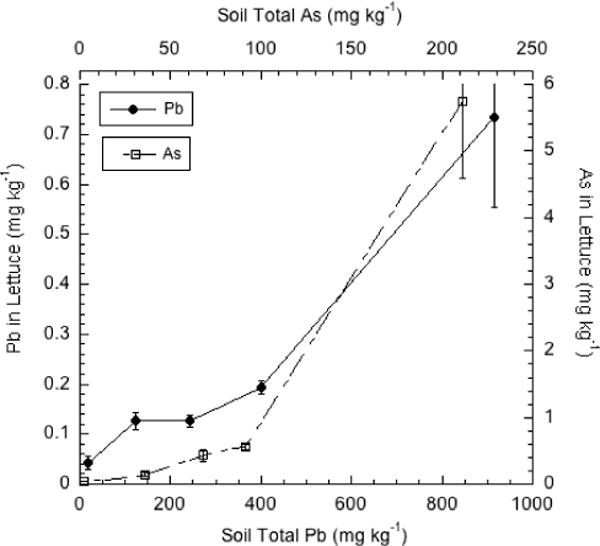
Pb and As concentrations (mg kg−1 d.w.) in lettuce grown on orchard soils containing a range of Pb and As. Error bars in this and subsequent figures depict plus and minus one standard deviation unit.
3.3. Carrot Crop
The concentrations of both Pb and As increased in the harvested carrot roots with increasing soil concentrations of these two contaminants (Figures 2 and 3), with carrot As showing an increasing uptake coefficient as soil As increased. A lower carrot Pb concentration than expected at the 400 mg/kg soil Pb concentration, based on the general trend in the data of Figure 2, is possibly the result of the somewhat higher soil pH in the A6 soil containing 400 mg/kg Pb.
Figure 2.
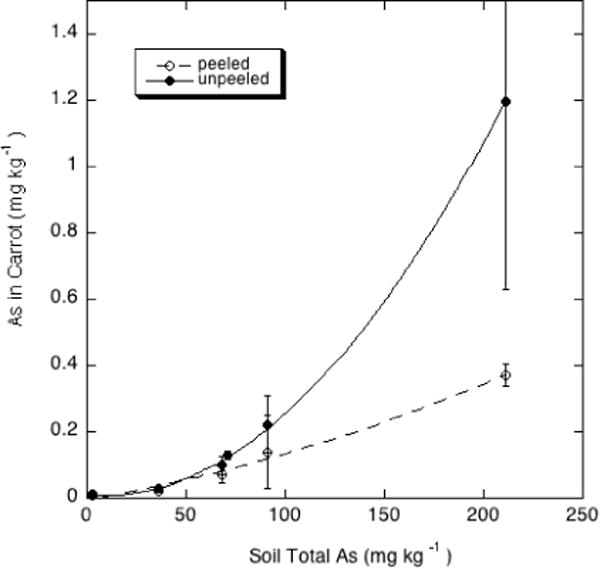
As concentrations (mg kg-1 d.w.) in peeled and unpeeled carrot roots grown on orchard soils containing a range of As contents.
Figure 3.
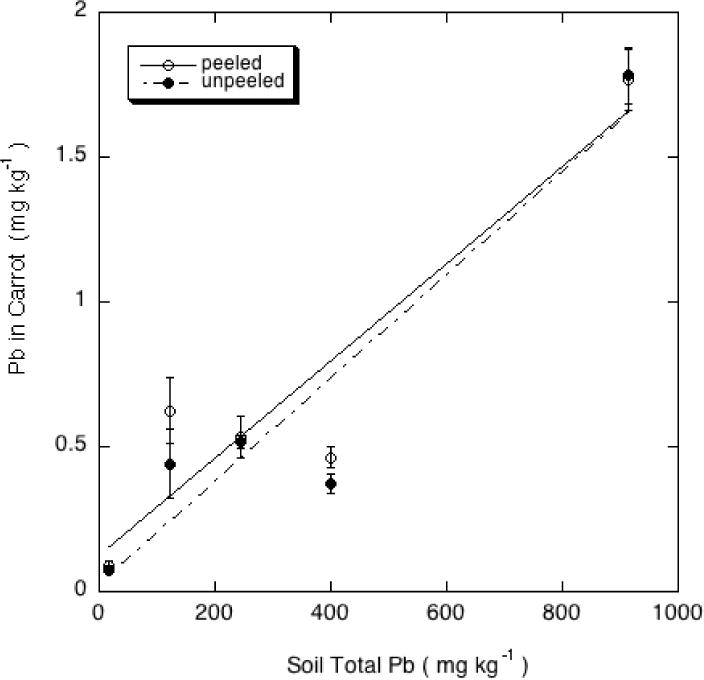
Pb concentrations (mg kg−1 d.w.) in peeled and unpeeled carrot roots grown on orchard soils containing a range of Pb contents.
Peeling the carrots before analysis had a small effect in increasing the root Pb concentrations, which ANOVA showed to be significant at the 5% level (p= 0.032). Such an effect suggests that the outer layers of the carrot root were lower in Pb than the bulk of the root. Peeling appeared to have a marked effect in reducing the root As concentrations, particularly in the most As-contaminated carrots (Figure 3), although ANOVA revealed that this effect did not quite reach significance at the 5% level (p= 0.063). A similar effect of peeling, producing opposite effects on As and Pb concentrations in carrots, was noted by Codling et al. [18].
Numerous studies indicate that Pb uptake from contaminated soils into root crops such as carrots is greater than that into vegetable fruits, and sometimes comparable to or higher than transfer into leafy greens [19–22]. In this study, the carrot root concentrations were higher than those in lettuce, but exceeded 1 mg/kg (dry wt. basis) only in the highest-Pb soil (G6 with total Pb in excess of 900 mg/kg). The As concentrations in the peeled and unpeeled carrots (Figure 2), in contrast, were lower than those in lettuce (Figure 1).
3.4. Bean Crop
The trend of increasing As in the harvested bean crop with increasing soil As is evident in Figure 4; the relative increase in crop As was sufficiently large that the As concentrations are best displayed on a logarithmic scale. However, there was no significant increase of Pb concentration in the edible bean pods with increasing soil Pb even at the highest soil Pb concentration. These results are consistent with the known tendency of plants to exclude Pb from the fruiting part of the plant [19–21]. Arsenic is not only more soluble and bioavailable than Pb in soils, but has a greater ability to translocate from roots to shoots in particular species such as members of the brassica family [23]. Thus, the highest As concentration measured in the edible bean pods averaged 4.2 mg/kg (d.w.) in the highest-As soil (G6, with total As exceeding 200 mg/kg, much higher than the Pb concentration in beans grown on the same soil.
Figure 4.
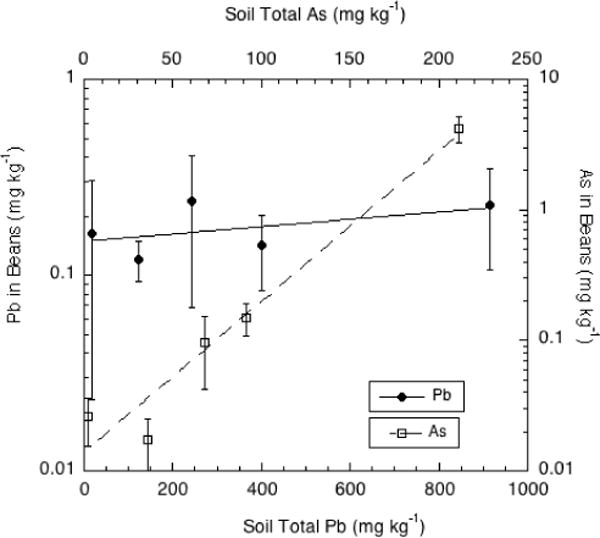
Pb and As concentrations (mg kg−1 d.w.) in green bean pods grown on orchard soils containing a range of Pb and As contents.
3.5. Tomato Crop
As shown by Figure 5, transfer of soil Pb and As into the tomato fruit was very limited, with only a small tendency for increasing Pb and As in soil to result in higher concentrations of these elements in the fruit. Only the fruit grown in soil with the highest Pb concentration contained a statistically higher concentration of Pb than the fruit grown on the control soil. In the case of As, none of the tomato fruit grown on the As-contaminated soils contained significantly higher As concentrations than the control fruit. These results are consistent with the general observation that the barrier to translocation of Pb within the plant protects fruit crops from significant Pb contamination [19]. The results also indicate that the well-known physiological barrier to As transfer from the vegetative part of the plant into seeds and fruits [24] is more pronounced in tomato than bean.
Figure 5.
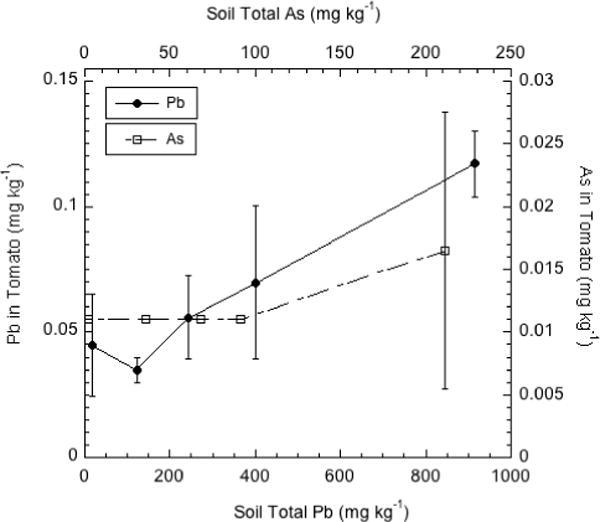
Pb and As concentrations (mg kg−1 d.w.) in tomato fruit grown on orchard soils containing a range of Pb and As.
3.6. Pb and As Uptake By All Crops
3.6.1. Pb and As Plant Uptake Factors
ANOVA revealed that for As and Pb, both the soil factor and crop type were highly significant (p < 0.0001) in determining the concentration of As in the edible crop. Thus, all crops contained significantly different concentrations of As and Pb when grown in the same soil, and therefore had different UCs. The effect of the different soils on Pb and As uptake is largely attributable to the very different concentrations of Pb and As in the soils selected for the study (with the exception of the strong impact of low pH in one soil, which was excluded from the ANOVA)
Table 2 summarizes slopes and r-values of linear regressions that relate plant tissue Pb and As concentrations to total and water-soluble Pb and As concentrations, respectively. Whereas all linear relationships between the vegetable crop As concentrations and soil total As or soluble As concentrations were significant (p< 0.05), virtually none of the comparable vegetable Pb- soil Pb relationships were. This means that As uptake into all crops was predicted more reliably by soil parameters (soluble or total As) than Pb uptake (as indicated by the greater r-values for As). Soluble Pb and As in the soils were only marginally better predictors of uptake into the crops than total soil Pb and As (as indicated by somewhat higher r-values).
Table 2.
Linear regression slopes and r-values (in parentheses) for correlations between vegetable Pb and As concentrations (mg/kg) and soil soluble (mg/L) and total Pb and As (mg/kg). R-values denoted with asterisks are significant at the 5 % level.
| Crop | Metal | Soil Parameter Tested | |
|---|---|---|---|
|
| |||
| Soluble Metal | Total Metal | ||
| Lettuce | Pb | 3.08 (0.805) | 0.000769 (0.970*) |
| As | 6.53 (0.998*) | 0.0288 (0.939*) | |
|
| |||
| Carrot (unpeeled) | Pb | 12.4 (0.717) | 0.00177 (0.943*) |
| As | 1.59 (0.997*) | 0.00609 (0.955*) | |
| Bean (pods) | Pb | 1.16 (0.346) | 7.70×10⁻⁵ (0.521) |
|
| |||
| As | 5.85 (0.991*) | 0.0213 (0.918*) | |
| Tomato (fruit) | Pb | 0.516 (0.851*) | 8.91×10⁻⁵ (0.977) |
| As | 0.0073 (0.942*) | 2.80×10⁻⁵ (0.908*) | |
Plant uptake coefficients (UCs), quantified by the uptake slopes for the crop metal-total soil metal regressions (see the last column of Table 2) show As UCs to be higher than those of Pb for the edible part of all crops except tomatoes. However, when these uptake factors are recalculated based on soluble rather than total metals in the soils, UCs for As are not consistently higher than those for Pb, an indication that low uptake of Pb into the crops is largely explained by very low Pb solubility in the soils, with the plant physiological barrier to uptake being a secondary factor.
3.6.2. Soil pH Effect on Pb and As Uptake
Because soils A3 and H11 had similar Pb and As contamination levels and other properties but very different pH values and exchangeable base cation contents, it was possible to compare uptake of Pb and As into the four vegetable crops as affected primarily by soil pH. The results of this comparison are shown in Figures 6 (for Pb) and 7 (for As). ANOVA revealed that both the soil factor (soil pH) and crop type were highly significant (p <0.0001) factors in determining crop Pb concentration, and all crops were significantly (p<0.002) different in Pb concentration. As expected based on the dependence of soil Pb solubility on pH, the lettuce and carrots grown on the more strongly acid soil had much higher Pb concentrations. For the vegetable fruits, bean and tomato, Pb was also higher for crops grown in the more acid soil, but the relative effect of pH on uptake into these vegetables was smaller. The order of Pb concentration in the edible portion of the crops grown in the acid soils was:
This order was different for the soil at pH 6.2, with carrot roots being the strongest Pb accumulator and lettuce having markedly reduced Pb uptake at the higher pH.
Figure 6.
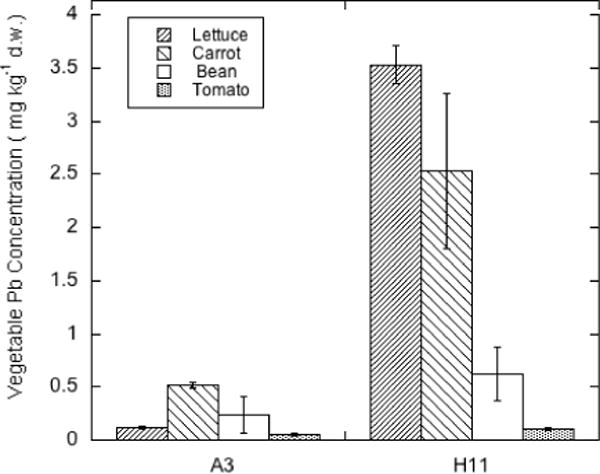
Pb concentrations (mg kg−1 d.w.) in lettuce, carrot, bean and tomato grown on orchard soils with similar total Pb but pH of 6.2 (A3) and 4.9 (H11).
Figure 7.
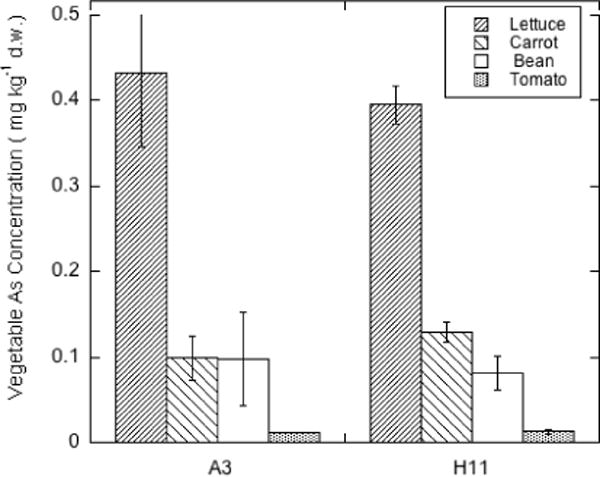
As concentrations (mg kg−1 d.w.) in lettuce, carrot, bean and tomato grown on orchard soils with similar total As but pH of 6.2 (A3) and 4.9 (H11).
ANOVA showed that, in contrast to the result for Pb, soil was not a significant factor in determining the As concentration in the crops (see Figure 7), although crop type was still highly significant (p < 0.0001). It is apparent from Figure 7 that As uptake was not strongly affected by soil pH, but crop type strongly affected As accumulation which followed the order:
The insensitivity of As uptake by the crops to soil pH may reflect the fact that As adsorption in these orchard soils is weaker than that of Pb and may be less pH-sensitive. Although As adsorption on variable-charge soil minerals such as Fe oxides increases at lower pH [14], adsorption on soils dominated by layer silicate clay mineralogy such as the orchard soils used in this study is not very pH-dependent in the pH 4.5–7.5 range [25]. Table 1 shows the less acid soil (A3) to have soluble As about 2-fold higher than that of the strongly acid soil (H11), suggesting that As solubility and phytoavailability in these orchard soils is controlled to a much greater degree by total soil As burden than pH.
3.7. Implications for Human Health
In order to provide an assessment of the potential health risk to gardeners consuming vegetables grown in old orchard site soils, the measured Pb and As in the vegetables grown in the greenhouse study were compared to international standards. For Pb, the EU standards have limits of 0.1 mg kg-1 (f.w.) for most vegetables, but a higher limit of 0.3 mg kg-1 for leafy greens. For As, a limit of 0.1 mg/kg (f.w.) has been recommended by health agencies within several countries. Using approximate water contents of the four vegetables included in this study, these maximum limits were converted to Pb and As concentrations on a dry weight (d.w.) basis, and the vegetable Pb and As concentration data presented in Figures 1–5 were compared to these limits. For lettuce, these dry weight-based recommended limits are 5.9 mg kg−1 for Pb and 2.0 mg kg−1 for As. For carrots, the limits are 0.8 mg kg−1 for both Pb and As. For beans and tomatoes, they are 0.9 and 1.7 mg kg−1, respectively, for both Pb and As.
Inspection of Figures 1–5 reveals that for lettuce, Pb levels remained well below the recommended limit even at a soil total Pb concentration of 915 mg kg−1. Conversely, As exceeded its limit once soil total As was well in excess of 100 mg kg−1. For carrots, Pb exceeded the limit only when grown in the soil containing the highest Pb level (915 mg/kg−1), although it also exceeded the limit in a more strongly acid soil containing much lower Pb (see Figure 6). Carrot As exceeded the limit only when unpeeled and grown in the soil with highest As (211 mg/kg−1) and unpeeled. Peeled carrots had As concentrations well below the limit even at the highest soil As level. For bush beans, Pb uptake into the edible pods was very insensitive to Pb concentration in the soil, and Pb concentrations in the edible crop were well below the Pb limit. This result indicates a strong physiological barrier to Pb translocation into the reproductive tissues of the crop. Conversely, As transfer into the bean pods was strongly sensitive to soil total As, and exceeded the As limit in soils with total As higher than about 100–150 mg/kg−1. This result indicates that As has a weaker physiological barrier than Pb to translocation into the edible pods. For tomato, there was a strong physiological barrier to both Pb and As transfer into the fruit, as the measured fruit concentrations of Pb and As were well below the recommended limits even for the most severely contaminated soil.
Generally, the vegetable fruits (bean, tomato) were less susceptible to contamination than lettuce or carrots, although As exceeding the recommended limits for all vegetables except tomato fruits when soil As exceeded 100–150 mg kg−1.
4. Conclusion
The extent of Pb and As transfer into the edible part of vegetables grown in orchard soils historically contaminated by Pb arsenate pesticides depended primarily on soil total Pb and As content, soil pH, and type of vegetable. Generally, As concentrations were highest in lettuce and green beans, lower in unpeeled carrots, and much lower in tomato fruit. Peeling reduced As concentrations in the carrot roots, but slightly increased Pb in the roots. Transfer of Pb into vegetables was generally lower than that of As for lettuce and beans. Pb tended to be strongly excluded from the fruit of tomato, although not as strongly as As. Only in the most contaminated soil, containing 915 and 211 mg/kg of Pb and As, respectively, did any vegetable Pb contamination levels, when converted to fresh-weight concentrations, exceed international standards. This was the case only for Pb in carrots. However, for As, fresh-weight concentrations in lettuce, unpeeled carrots and green beans exceeded the standard of 0.1 mg kg−1 (f.w.) at the highest soil As concentration (211 mg kg−1). Vegetable contamination generally (with the exception of tomato) increased non-linearly in response to soil contamination level; that is, plant uptake coefficients (UCs) increased at higher soil total Pb and As. In addition, lowered soil pH had a dramatic effect in increasing Pb in lettuce and carrots in particular, but had little effect on crop As contamination. Caution is advised in generalizing these results for commonly grown vegetables to all vegetable types; for As in particular, there is evidence for strong differences among plant species in potential for uptake. Additionally, the potential for vegetable contamination by Pb may be lower in the greenhouse than in the field. Research has indicated aerial deposition of dust or soil splash to be responsible for most of the contamination of field-grown leafy vegetables, and Pb can thereby reach substantially higher concentrations than those measured in this study [10].
Acknowledgments
This research was funded in part by the National Institutes of Health and the National Institute of Environmental Health Sciences Grant #15R21ES017921. The author thanks Leigh Kalbacker and Sarah Wharton for their assistance with this study.
References
- 1.Veneman PLM, Murray JR, Baker JH. Spatial distribution of pesticide of pesticide residues in a former apple orchard. J Environ Qual. 1983;12:101–104. [Google Scholar]
- 2.Hood E. The apple bites back: claiming old orchards for residential development. Environ Health Persp. 2006;114:A471–A476. doi: 10.1289/ehp.114-a470. [DOI] [PMC free article] [PubMed] [Google Scholar]
- 3.Schooley T, Weaver MJ, Mullins D, Eick M. The history of lead arsenate use in apple production: comparison of its impact in Virginia with other States. J Pesticide Safety Ed. 2008;10:22–53. [Google Scholar]
- 4.Kenyon DJ, Elfving DC, Pakkala IS, Bache CA, Lisk DJ. Residues of lead and arsenic in crops cultured on old orchard soils. Bull Environ Tox. 1979;22:221–223. doi: 10.1007/BF02026933. [DOI] [PubMed] [Google Scholar]
- 5.MacLean KS, Langille WM. Arsenic in orchard and potato soils and plant tissue. Plant Soil. 1981;61:413–418. [Google Scholar]
- 6.Aten CF, Bourke JB, Martini JH, Walton JC. Arsenic and lead in an orchard environment. Bull Environm Contam Toxicol. 1980;24:108–115. doi: 10.1007/BF01608083. [DOI] [PubMed] [Google Scholar]
- 7.Creger TL, Peryea FJ. Lead and arsenic in two apricot cultivars and in ‘Gala’ apples grown on lead arsenate-contaminated soils. HortSci. 1992;27:1277–1278. [Google Scholar]
- 8.Bishop RF, Chisholm D. Arsenic accumulation in Annapolis valley orchard soils. Can J Soil Sci. 1962;42:77–80. [Google Scholar]
- 9.Ross RG, Crowe AD. Further studies on replant disease of apple in Nova Scotia. Can Plant Disease Survey. 1976;56:88–92. [Google Scholar]
- 10.McBride MB, Simon T, Tam G, Wharton S. Lead and arsenic uptake by leafy vegetables grown on contaminated soils: effects of mineral and organic amendments. Water Air Soil Poll. 2012;224:1378–1387. doi: 10.1007/s11270-012-1378-z. [DOI] [PMC free article] [PubMed] [Google Scholar]
- 11.Allison LE. Organic carbon. In: Black CA, editor. Methods of Soil Analysis Part 2. American Society of Agronomy; Madison, WI: pp. 1367–1378. [Google Scholar]
- 12.Ross DS, Ketterings Q. Recommended Methods for Determining Soil Cation Exchange Capacity. (Northeastern Regional Publication No. 493).Recommended Soil Testing Procedures for the Northeastern United States. 2011:75–85. [Google Scholar]
- 13.Fleming M, Tai Y, Zhuang P, McBride MB. Extractability and bioavailability of Pb and As in historically contaminated orchard soil: effects of compost amendments. Environ Poll. 177:90–97. doi: 10.1016/j.envpol.2013.02.013. [DOI] [PMC free article] [PubMed] [Google Scholar]
- 14.Pierce ML, Moore CB. Adsorption of arsenite and arsenate on amorphous iron hydroxide. Water Res. 1982;16:1247–1253. [Google Scholar]
- 15.DeBrouwere K, Smolders E, Merckx R. Soil properties affecting solid-liquid distribution of As(V) in soils. Eur J Soil Sci. 2004;55:165–173. [Google Scholar]
- 16.Jiang W, Zhang S, Shan X, Feng M, Zhu Y-G, McLaren RG. Adsorption of arsenate on soils. Part 2: Modeling the relationship between adsorption capacity and soil physiochemical properties using 16 Chinese soils. Environ Poll. 2005;138:285–289. doi: 10.1016/j.envpol.2005.03.008. [DOI] [PubMed] [Google Scholar]
- 17.Imamul Huq SM, Joardar JC, Parvin S, Correll R, Naidu R. Arsenic contamination in food-chain: transfer of arsenic into food materials through groundwater irrigation. J Health Popul Nutr. 2006;24:305–316. [PMC free article] [PubMed] [Google Scholar]
- 18.Codling EE, Chaney RL, Green CE. Lead and arsenic uptake by carrots grown on five orchard soils with history of lead arsenate used. ASA Int Meeting Abstracts. 2007:241. [Google Scholar]
- 19.Samsoe-Petersen L, Larsen EH, Larsen PB, Bruun P. Uptake of trace elements and PAHs by fruit and vegetables from contaminated soils. Environ Sci Technol. 2002;36:3057–3063. doi: 10.1021/es015691t. [DOI] [PubMed] [Google Scholar]
- 20.Alexander PD, Alloway BJ, Dourado AM. Genotypic variations in the accumulation of Cd, Cu, Pb and Zn exhibited by six commonly grown vegetables. Environ Poll. 2006;144:736–745. doi: 10.1016/j.envpol.2006.03.001. [DOI] [PubMed] [Google Scholar]
- 21.Preer JR, Sekhon HS, Stephens BR, Collins MS. Factors affecting heavy metal content of garden vegetables. Environ Poll(Series B) 1. 1980:95–104. [Google Scholar]
- 22.Moir AM, Thornton I. Lead and cadmium in urban allotment and garden soils and vegetables in the United Kingdom. Environ Geochem Health. 1989;11:113–119. doi: 10.1007/BF01758660. [DOI] [PubMed] [Google Scholar]
- 23.Raab A, Williams PN, Meharg A, Feldmann J. Uptake and translocation of inorganic and methylated arsenic species by plants. Environ Chem. 2007;4:197–203. [Google Scholar]
- 24.Singh N, Ma LQ. Assessing plants for phytoremediation of arsenic-contaminated soils. In: Willey N, editor. Methods in Biotechnology, Phytoremediation: Methods and Reviews. Vol. 23. Humana Press Inc.; Totowa, NJ: 2007. pp. 319–347. [Google Scholar]
- 25.Goldberg S, Lesch SM, Suarez DL. Predicting arsenate adsorption by soils using soil chemical parameters in the constant capacitance model. Soil Sci Soc Am J. 2005;69:1389–1398. [Google Scholar]


